[Preprint]. 2024 Aug 8:2024.08.02.24311413.
doi: 10.1101/2024.08.02.24311413.

The breath volatilome is shaped by the gut microbiota

Affiliations

The breath volatilome is shaped by the gut microbiota

Ariel J Hernandez-Leyva et al. medRxiv. .

Abstract

The gut microbiota is widely implicated in host health and disease, inspiring translational efforts to implement our growing body of knowledge in clinical settings. However, the need to characterize gut microbiota by its genomic content limits the feasibility of rapid, point-of-care diagnostics. The microbiota produces a diverse array of xenobiotic metabolites that disseminate into tissues, including volatile organic compounds (VOCs) that may be excreted in breath. We hypothesize that breath contains gut microbe-derived VOCs that inform the composition and metabolic state of the microbiota. To explore this idea, we compared the breath volatilome and fecal gut microbiomes of 27 healthy children and found that breath VOC composition is correlated with gut microbiomes. To experimentally interrogate this finding, we devised a method for capturing exhaled breath from gnotobiotic mice. Breath volatiles are then profiled by gas-chromatography mass-spectrometry (GC-MS). Using this novel methodology, we found that the murine breath profile is markedly shaped by the composition of the gut microbiota. We also find that VOCs produced by gut microbes in pure culture can be identified in vivo in the breath of mice monocolonized with the same bacteria. Altogether, our studies identify microbe-derived VOCs excreted in breath and support a mechanism by which gut bacterial metabolism directly contributes to the mammalian breath VOC profiles.


Conflict of interest statement

Competing interests: A.L.K. is a scientific advisory board member and receives licensing fees from Ancilia Biosciences; and receives funding from the NIH and Doris Duke Charitable Foundation. A.L.R. receives licensing fees from Ancilia Biosciences.

Figures
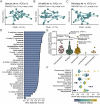
Fig. 1:
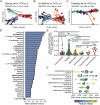
Fig. 1:. The pediatric gut microbiome influences the host breath volatilome.
A) Procrustean rotation comparing the UniFrac distances describing subject microbiome taxonomic composition (points) against the Manhattan distances comparing subject breath volatilome (arrows). B) Procrustean rotation comparing the Manhattan distances describing the abundances of subject gut uniref90 gene clusters (points) against the Manhattan distances comparing subject breath volatilome (arrows). C) Procrustean rotation comparing the Manhattan distances describing subject gut metagenomic pathways (points) against the Manhattan distances comparing subject breath volatilome (arrows). D) The mean explained variances (R2) of individual random forest models predicting the abundance of a particular VOC given the taxonomic composition of the gut metagenome. Terpenes are bolded. E) Plot of the importance of individual taxa across the models, estimated as the mean of the absolute value of the SHAP scores for that taxon in its respective model. Individual points represent the Importance of a taxon in one of the models. F) Sample SHAP scores for the top seven most important model/taxa pairings. Feature values were ranked to show trends against the SHAP score.
Fig. 2:
Fig. 2:. A murine ventilator can be used to collect murine exhaled breath.
A) Overview of the mouse ventilator set-up to collect exhaled breath while providing defined air. B) Box plot representing the abundance of isoprene in the exhaled breath of mice receiving daily isoprene doses for 14 days, in exhaled breath of mice receiving concurrent daily vehicle controls, or in the ambient air alone. Between group comparisons were conducted using t-tests with FDR multiple hypothesis correction. C) Representative chromatograms depicting the signal measured from output air collected from the ventilator after attaching an airtight plastic loop instead of a mouse. Signals were characterized from air collected with defined input air or input air collected from an empty conference room.
Fig. 3:
Fig. 3:. Overview of a gnotobiotic animal model for testing the contribution of the gut microbiota to the breath volatilome.
A) The exhaled breath of conventionally raised male and female mice sourced from either Taconic Biosciences or the Jackson Laboratory was collected and characterized. The cecal contents of the conventionally-raised mice from the same vendor and of the same sex were pooled and used to colonize sex-matched gnotobiotic recipients, yielding four more microbiome groups: male gnotobiotic mice colonized with cecal contents from male Jackson Lab mice, female gnotobiotic mice colonized with cecal contents from female Jackson Lab mice, male gnotobiotic mice colonized with cecal contents from male Taconic Biosciences mice, female gnotobiotic mice colonized with cecal contents from female Taconic Biosciences mice. Breath was collected and characterized from these mice one week after colonization. Breath was collected from germ-free control mice at all timepoints.
Fig. 4:
Fig. 4:. The gut microbiota influences the host mouse exhaled breath volatilome.
A) Procrustean rotation comparing the UniFrac distances describing mouse microbiome taxonomic composition (points) against the Manhattan distances comparing subject breath volatilome (arrows). B) Procrustean rotation comparing the Manhattan distances describing the abundances of mouse gut uniref90 gene clusters (points) against the Manhattan distances comparing mouse breath volatilome (arrows). C) Procrustean rotation comparing the Manhattan distances describing mouse gut metagenomic pathways (points) against the Manhattan distances comparing mouse breath volatilome (arrows). D) The mean explained variances (R2) of individual random forest models predicting the abundance of a particular VOC given the taxonomic composition of the gut metagenome of mice. Terpenes are bolded. E) Plot of the importance of individual taxa across the models, estimated as the mean of the absolute value of the SHAP scores for those taxa in its respective model. Individual points represent the Importance of a taxa in one of the models. F) Sample SHAP scores for the top seven most important model/taxa pairings. Feature values were ranked to show trends against the SHAP score.
Fig. 5:
Fig. 5:. Collection of microbial derived VOCs from anaerobic bacteria.
A) Cartoon depicting the collection of anaerobic culture headspace by drawing defined anaerobic air through the headspace of confluent culture and across a thermal desorption tube. B) Box-plot depicting the abundance of indole in the headspace of confluent culture of WT B. thetaiotaomicron, confluent culture of B. thetaiotaomicron deficient in tryptophanase (DtnaA), and sterile media controls. Between group comparisons were conducted using Mann-Whitney tests with Benjamini-Hochberg multiple hypothesis correction. C) Principal coordinates analysis depicting Manhattan distances between the volatilomes of the culture headspaces of A. muciniphila, B. longum, E. coli, and sterile media controls.
Fig. 6:
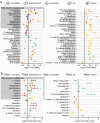
Fig. 6:. Overview of discriminatory microbially-associated VOCs in anaerobic culture headspace and the exhaled breath of monocolonized mice.
A) Forest plot denoting the 95%-confidence interval around the mean log2 fold difference between a VOC in the anaerobic culture headspace of a given organism and respective media controls. Confidence interval was estimated using the pooled variance of both culture and media abundances of VOCs. B) Forest plot denoting the 95%-confidence interval around the mean log2 fold difference between a VOC in the breath of mice colonized with a given organism and the breath of germ-free controls. Confidence interval was estimated using the pooled variance of both colonized and germ-free mouse breath abundances of VOCs. Terpenes are bolded.
Fig. 7:
Fig. 7:. Comparing the volatilome of anaerobic culture headspace to the exhaled breath of monocolonized mice identifies potential gut microbiota-derived breath VOCs.
Plot comparing the means and 95% confidence-intervals of the log2 fold difference in VOC abundances between culture headspace or colonized mouse breath and media headspace or germ-free mouse breath, respectively. Confidence intervals were estimated using the pooled variance of both colonized/culture samples and germ-free/media controls.

Similar articles

References

    1. de Lacy Costello B., Amann A., Al-Kateb H., Flynn C., Filipiak W., Khalid T., Osborne D., Ratcliffe N. M., A review of the volatiles from the healthy human body. J Breath Res 8, 014001 (2014). - PubMed
    1. Azim A., Barber C., Dennison P., Riley J., Howarth P., Exhaled volatile organic compounds in adult asthma: a systematic review. Eur Respir J 54, 1900056 (2019). - PubMed
    1. Rufo J. C., Madureira J., Fernandes E. O., Moreira A., Volatile organic compounds in asthma diagnosis: a systematic review and meta-analysis. Allergy 71, 175–188 (2016). - PubMed
    1. Nurmatov U. B., Tagiyeva N., Semple S., Devereux G., Sheikh A., Volatile organic compounds and risk of asthma and allergy: a systematic review. Eur Respir Rev 24, 92–101 (2015). - PMC - PubMed
    1. Bannaga A. S., Farrugia A., Arasaradnam R. P., Diagnosing Inflammatory bowel disease using noninvasive applications of volatile organic compounds: a systematic review. Expert Rev Gastroenterol Hepatol 13, 1113–1122 (2019). - PubMed

Publication types

LinkOut - more resources

  NODES
Idea 1
idea 1
twitter 2