. 2024 Sep 19;38(15-16):738-754.
doi: 10.1101/gad.351789.124.

The SAGA acetyltransferase module is required for the maintenance of MAF and MYC oncogenic gene expression programs in multiple myeloma

Affiliations

The SAGA acetyltransferase module is required for the maintenance of MAF and MYC oncogenic gene expression programs in multiple myeloma

Ying-Jiun C Chen et al. Genes Dev. .

Abstract

Despite recent advances in therapeutic treatments, multiple myeloma (MM) remains an incurable malignancy. Epigenetic factors contribute to the initiation, progression, relapse, and clonal heterogeneity in MM, but our knowledge on epigenetic mechanisms underlying MM development is far from complete. The SAGA complex serves as a coactivator in transcription and catalyzes acetylation and deubiquitylation. Analyses of data sets in the Cancer Dependency Map Project revealed that many SAGA components are selective dependencies in MM. To define SAGA-specific functions, we focused on ADA2B, the only subunit in the lysine acetyltransferase (KAT) module that specifically functions in SAGA. Integration of RNA sequencing (RNA-seq), assay for transposase-accessible chromatin with sequencing (ATAC-seq), and cleavage under _targets and release using nuclease assay (CUT&RUN) results identified pathways directly regulated by ADA2B including MTORC1 signaling and oncogenic programs driven by MYC, E2F, and MM-specific MAF. We discovered that ADA2B is recruited to MAF and MYC gene _targets, and that MAF shares a majority of its _targets with MYC in MM cells. Furthermore, we found that the SANT domain of ADA2B is required for interaction with both GCN5 and PCAF acetyltransferases, incorporation into SAGA, and ADA2B protein stability. Our findings uncover previously unknown SAGA KAT module-dependent mechanisms controlling MM cell growth, revealing a vulnerability that might be exploited for future development of MM therapy.

Keywords: ADA2B; MAF; MYC; SAGA complex; SANT domain; multiple myeloma; oncogenic gene expression programs.


Figures

Figure 1.
Figure 1.
SAGA-specific ADA2B is a dependency in multiple myeloma. (A) Components of the SAGA complex. (Pink) Lysine acetyltransferase (KAT) module, (yellow) deubiquitinase (DUB) module, (purple) splicing module, (green) core module, (blue) transcription factor (TF)-binding module. Components specific to SAGA are indicated in red. Relative positions of components are illustrated based on the previously reported cryogenic electron microscopy structure of human SAGA (Herbst et al. 2021). (B) The mean values of dependency scores and expression of ADA2B across cancer cell lines derived from various lineages found in CRISPR DepMap and Sanger (Score) databases (DepMap 23Q2+ Score, Chronos). (C) The top 20 codependencies of ADA2B across the same cancer cell lines as in B. Components specific to the SAGA complex are indicated in red. SAGA KAT module components are indicated in pink. (D) Dependency scores of SAGA components in KAT, core, and DUB modules for multiple myeloma (MM) cell lines. (E) Cell viability assay of Dox-inducible shRNA lines. A one-way analysis of variance (ANOVA) was performed to analyze the differences among group means, followed by the Tukey HSD post-hoc test to determine whether the mean differences between specific group pairs are statistically significant. (*) P < 0.05, (NS) not significant: P > 0.05.
Figure 2.
Figure 2.
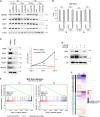
ADA2B is required for maintenance of oncogenic gene expression programs. (A) Immunoblots showing levels of ADA2B, GCN5, PCAF, and H3K9ac in cells harboring shNT or shADA2B with or without Dox treatment. Histone H3 is included as a loading control. (B) Volcano plot of gene expression changes detected by RNA sequencing (RNA-seq) in shADA2B cells relative to shNT cells after 5 days of Dox treatment. Genes with statistically significant (false discovery rate [FDR] ≤ 0.05) differential expression and fold change (FC) ≥ 1.5 (indicated by dashed lines) include 474 downregulated genes and 502 upregulated genes. (C) The top five gene expression pathways identified by gene set enrichment analysis (GSEA) that were enriched in downregulated genes in shADA2B cells relative to shNT cells after 3 and 5 days of Dox treatment. (D) Enrichment plots for E2F _targets, MYC _targets v1, and G2/M checkpoint hallmarks. (E) Volcano plot of chromatin accessibility changes detected by assay for transposase-accessible chromatin with sequencing (ATAC-seq) in shADA2B cells relative to shNT cells after 5 days of Dox treatment. Statistically significant (FDR ≤ 0.05) differential peaks with FC ≥ 1.5 (indicated by dashed lines) include 5230 decreased peaks and 2357 increased peaks. (F) The top five TF motifs enriched in decreased ATAC-seq peaks in shADA2B cells relative to shNT cells after 5 days of Dox treatment. (G) Normalized read coverage around centers of ATAC-seq peaks associated with 474 markedly downregulated genes (FC ≥ 1.5, FDR ≤ 0.05) in shADA2B cells relative to shNT cells after 5 days of Dox treatment. (H) Venn diagram depicting the overlap between all downregulated genes (FDR ≤ 0.05) and genes with decreased accessibility (FDR ≤ 0.05) in shADA2B cells relative to shNT cells after 5 days of Dox treatment.
Figure 3.
Figure 3.
ADA2B is recruited to promoters of genes involved in tumorigenesis. (A) Heat maps of FLAG-3xHA-ADA2B signals, H3K9ac signals in cells expressing FLAG-3xHA, and differential ATAC-seq signals in shADA2B cells relative to shNT cells after 5 days of Dox treatment. Signals are centered around the summits of FLAG-3xHA-ADA2B peaks. Peaks are ranked by FLAG-3xHA-ADA2B signals within 1 kb of peak summits. (Blue) ATAC-seq decreased peaks, (red) ATAC-seq increased peaks. Metaplots at the right summarize the average signals of FLAG-3xHA-ADA2B, H3K9ac, and differential ATAC-seq around FLAG-3xHA-ADA2B peaks in promoter and nonpromoter regions. (B) Pie chart depicting genomic distribution of FLAG-3xHA-ADA2B and H3K9ac in cells expressing FLAG-3xHA, and decreased ATAC-seq peaks in shADA2B cells relative to shNT cells after 5 days of Dox treatment. (C) Bar chart showing the quantity of decreased and increased ATAC-seq peaks associated with ADA2B-bound genes in shADA2B cells relative to shNT cells after 3 and 5 days of Dox treatment. (D) Venn diagram depicting the overlap between ADA2B promoter-bound genes (FDR ≤ 0.05) and downregulated genes (FDR ≤ 0.05) in shADA2B cells relative to shNT cells after 5 days of Dox treatment, identifying 356 ADA2B core _targets. ADA2B core _targets include >40 genes involved in cell cycle and cell division, 23 genes involved in MTORC1 signaling, and known regulators of MM biology. (E) The top five canonical pathways of ADA2B core _targets identified by IPA. (F) The top five upstream regulators of ADA2B core _targets identified by IPA. (G) Cell cycle analysis of cells harboring sgADA2B or control sgLacZ. The percentage of events in each cell cycle stage for three biological replicates is graphed. A one-way ANOVA was performed to analyze the differences among group means, followed by the Tukey HSD post-hoc test to determine whether the mean differences between specific group pairs are statistically significant. (**) P < 0.01, (NS) P > 0.05.
Figure 4.
Figure 4.
ADA2B promotes MAF protein levels and MAF expression programs. (A) Immunoblots showing the levels of MYC, E2F1, and MAF in cells harboring shNT or shADA2B with or without Dox treatment. β-Tub is included as a loading control. (B) Transcript levels of MAF in FPKM (fragments per kilobase per million) in shNT and shADA2B cells with and without Dox treatment as determined by RNA-seq. (C) The effects of CPTH6 treatment on MM.1S cells. (Left) Immunoblots showing MAF, MYC, GCN5, PCAF, and ADA2B levels in MM.1S cells treated with 10 μM CPTH6 for 3 days in comparison with DMSO vehicle control. Histone H3 is included as a loading control. (Right) Cell viability assay of MM.1S cells treated with 10 μM CPTH6. A one-way ANOVA was performed to analyze the differences among group means, followed by the Tukey HSD post-hoc test to determine whether the mean differences between specific group pairs are statistically significant. (***) P < 0.001, (**) P < 0.01, (NS) P > 0.05. (D) Immunoblots of MM.1S cells with 10 μM CPTH6 or DMSO treatment for 3 days and subsequent treatment with 10 μM MG132 or DMSO for 5 h. Histone H3 is included as a loading control. (E) GSEA plots demonstrating enrichment of the MAF gene signature from Zhan et al. (2006) (Zhan multiple myeloma MF up) in the genome-wide expression changes induced by Dox treatment for 3 and 5 days in shADA2B cells compared with shNT cells. (F) Heat map showing expression of selected MAF core _targets in shADA2B cells compared with shNT cells after 3 and 5 days of Dox treatment. Genes directly bound by ADA2B as determined by our CUT&RUN data are highlighted in green.
Figure 5.
Figure 5.
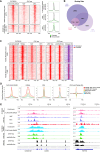
ADA2B directly binds to MAF and MYC _targets. (A) Heat maps of FLAG-3xHA-ADA2B, MAF, and MYC signals around the summits of FLAG-3xHA-ADA2B peaks from our CUT&RUN analysis for ADA2B and from published ChIP-seq data sets for MAF and MYC (Lin et al. 2012; Katsarou et al. 2023). Peaks are ranked by FLAG-3xHA-ADA2B signals within 1 kb of peak summits. The metaplots at the right summarize the average signals of FLAG-3xHA-ADA2B, MAF, and MYC around FLAG-3xHA-ADA2B peaks in promoter and nonpromoter regions. (B) Venn diagram depicting the overlaps between ADA2B, MAF, and MYC binding sites (peaks). (C) Heat maps of FLAG-3xHA-ADA2B, MAF, and MYC signals around the centers of peaks identified for FLAG-3xHA-ADA2B, MAF, and MYC, respectively. H3K9ac, ATAC-seq, and differential ATAC-seq signals in shADA2B cells relative to shNT cells after 5 days of Dox treatment are also shown. (Top panels) Signals around peaks shared among ADA2B, MAF, and MYC. (Bottom panels) Signals around peaks shared between ADA2B and MYC. (Blue) ATAC-seq decreased peaks, (red) ATAC-seq increased peaks. (D) Metaplots of FLAG-3xHA-ADA2B, H3K9ac, MAF, MYC, and differential ATAC-seq signals shown in C and Supplemental Figure S7D. (E) Signal tracks of FLAG-3xHA-ADA2B, MAF, MYC, RNA polymerase II (Pol II), and H3K9ac at CCND2 and RNF183 loci. Signals from ATAC-seq and RNA-seq in shADA2B and shNT cells after 5 days of Dox treatment are also shown.
Figure 6.
Figure 6.
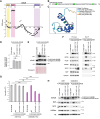
The SANT domain of ADA2B is required for GCN5/PCAF interaction, SAGA incorporation, and ADA2B protein stability. (A) Mapping of regions hypersensitive to CRISPR KO in the ADA2B protein by ProTiler (He et al. 2019a). Higher SVM scores indicate higher essentiality. An illustration of domains in the ADA2B protein is shown at the top. (B) Sequence of the SANT domain in ADA2B. The three predicted core hydrophobic residues (W70, W90, and Y110) are highlighted in green. (C) The structure of the SANT domain in ADA2B as predicted by AlphaFold (Jumper et al. 2021; Varadi et al. 2022). The three predicted core hydrophobic residues (W70, W90, and Y110) are highlighted in green. AlphaFold generates a per-residue confidence score (pLDDT) ranging from 0 to 100. (D) Relative RNA expression of ADA2B, including endogenous and exogenous levels, in MM.1S cell lines expressing FLAG-3xHA, FLAG-3xHA-ADA2B, FLAG-3xHA-ADA2BW70A W90A Y110A, or FLAG-3xHA-ADA2BW70F W90F Y110F as determined by qRT-PCR. A one-way ANOVA was performed to analyze the differences among group means, followed by the Tukey HSD post-hoc test to determine whether the mean differences between specific group pairs are statistically significant. (NS) P > 0.05. (E) Immunoblots showing levels of FLAG-3xHA-ADA2B and endogenous ADA2B in the same cell lines as in D. Histone H3 blot and Ponceau S staining are included as loading controls. (F) Immunoblots showing coimmunoprecipitation (co-IP) results for FLAG-3xHA, FLAG-3xHA-ADA2B, FLAG-3xHA-ADA2BW70A W90A Y110A, and FLAG-3xHA-ADA2BW70F W90F Y110F using the same cell lines as in D and E. GAPDH is included as a loading control for input samples. (G) Cell viability assay of MM.1S cells expressing exogenous wild type (WT) or SANT domain mutants of ADA2B and treated with Dox for 9 days to knock down endogenous ADA2B. A one-way ANOVA was performed to analyze the differences among group means, followed by the Tukey HSD post-hoc test to determine whether the mean differences between specific group pairs are statistically significant. (***) P < 0.001, (**) P < 0.01, (NS) P > 0.05. (H) Immunoblots showing levels of FLAG-3xHA-ADA2B, endogenous ADA2B, MAF, MYC, and H3K9ac in the same cell lines as in G. Histone H3 is included as a loading control.

Update of

Similar articles

Cited by

References

    1. Alvarez-Benayas J, Trasanidis N, Katsarou A, Ponnusamy K, Chaidos A, May PC, Xiao X, Bua M, Atta M, Roberts IAG, et al. 2021. Chromatin-based, in cis and in trans regulatory rewiring underpins distinct oncogenic transcriptomes in multiple myeloma. Nat Commun 12: 5450. 10.1038/s41467-021-25704-2 - DOI - PMC - PubMed
    1. Alzrigat M, Jernberg-Wiklund H, Licht JD. 2018a. _targeting EZH2 in multiple myeloma—multifaceted anti-tumor activity. Epigenomes 2: 16. 10.3390/epigenomes2030016 - DOI - PMC - PubMed
    1. Alzrigat M, Párraga AA, Jernberg-Wiklund H. 2018b. Epigenetics in multiple myeloma: from mechanisms to therapy. Semin Cancer Biol 51: 101–115. 10.1016/j.semcancer.2017.09.007 - DOI - PubMed
    1. Arede L, Foerner E, Wind S, Kulkarni R, Domingues AF, Giotopoulos G, Kleinwaechter S, Mollenhauer-Starkl M, Davison H, Chandru A, et al. 2022. KAT2A complexes ATAC and SAGA play unique roles in cell maintenance and identity in hematopoiesis and leukemia. Blood Adv 6: 165–180. 10.1182/bloodadvances.2020002842 - DOI - PMC - PubMed
    1. Bergsagel PL, Kuehl WM. 2003. Critical roles for immunoglobulin translocations and cyclin D dysregulation in multiple myeloma. Immunol Rev 194: 96–104. 10.1034/j.1600-065X.2003.00052.x - DOI - PubMed

MeSH terms

Substances

LinkOut - more resources

  NODES
Project 1
twitter 2