Do Surrogate Markers of Cardiorespiratory Fitness Predict Individual Changes in VO2peak? A Randomized Controlled Trial
- PMID: 39258120
- PMCID: PMC11385293
Do Surrogate Markers of Cardiorespiratory Fitness Predict Individual Changes in VO2peak? A Randomized Controlled Trial
Abstract
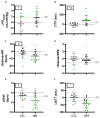
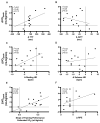
The purpose of the current study was to test the hypothesis that individual response classification for surrogate markers of cardiorespiratory fitness (CRF) will agree with response classification for VO2peak. Surrogate markers of CRF were time to fatigue on treadmill test (TTF), time trial performance (3kTT), resting heart rate (RHR), submaximal heart rate (SubmaxHR), and submaximal ratings of perceived exertion (SubmaxRPE). Twenty-five participants were randomized into a high-intensity interval training (HIIT: n = 14) group or non-exercise control group (CTL: n = 11). Training consisted of four weeks of high-intensity interval training (HIIT) - 4x4 minute intervals at 90-95% HRmax 3 times per week. We observed poor agreement between response classification for VO2peak and surrogate markers (agreement < 60% for all outcomes). Although surrogate markers and VO2peak correlated at the pre- and post-intervention time points, change scores for VO2peak were not correlated with changes in surrogate markers of CRF. Interestingly, a significant relationship (r 2 = 0.36, p = 0.02) was observed when comparing improvements in estimated training performance (VO2) and change in VO2peak. Contrary to our hypothesis, we observed poor classification agreement and non-significant correlations for changes scores of VO2peak and surrogate markers of CRF. Our results suggest that individuals concerned with their VO2peak response seek direct measurements of VO2.
Keywords: Responders; measurement error; patterns of response.
Figures


Similar articles
-
Cardiorespiratory Fitness Benefits of High-Intensity Interval Training After Stroke: A Randomized Controlled Trial.Stroke. 2024 Sep;55(9):2202-2211. doi: 10.1161/STROKEAHA.124.046564. Epub 2024 Aug 7. Stroke. 2024. PMID: 39113181 Clinical Trial.
-
High-intensity interval versus moderate-intensity continuous cycling training in Parkinson's disease: a randomized trial.J Appl Physiol (1985). 2024 Sep 1;137(3):603-615. doi: 10.1152/japplphysiol.00219.2024. Epub 2024 Jul 15. J Appl Physiol (1985). 2024. PMID: 39008618 Clinical Trial.
-
Validity of the modified shuttle walk test to assess cardiorespiratory fitness after exercise intervention in overweight/obese adults with primary hypertension.Clin Exp Hypertens. 2019;41(4):336-341. doi: 10.1080/10641963.2018.1481423. Epub 2018 Jun 14. Clin Exp Hypertens. 2019. PMID: 29902061
-
A systematic review and cluster analysis approach of 103 studies of high-intensity interval training on cardiorespiratory fitness.Eur J Prev Cardiol. 2024 Mar 4;31(4):400-411. doi: 10.1093/eurjpc/zwad309. Eur J Prev Cardiol. 2024. PMID: 37738464 Review.
-
Effect of High-Intensity Interval Training vs. Moderate-Intensity Continuous Training on Fat Loss and Cardiorespiratory Fitness in the Young and Middle-Aged a Systematic Review and Meta-Analysis.Int J Environ Res Public Health. 2023 Mar 8;20(6):4741. doi: 10.3390/ijerph20064741. Int J Environ Res Public Health. 2023. PMID: 36981649 Free PMC article. Review.
References
-
- Atkinson G, Batterham AM. True and false interindividual differences in the physiological response to an intervention. Exp Physiol. 2015;100(6):577–588. - PubMed
-
- Billat V, Demarle A, Paiva M, Koralsztein JP. Effect of training on the physiological factors of performance in elite marathon runners (males and females) Int J Sports Med. 2002;23(5):336–341. - PubMed
-
- Blair SN, Kohl HW, Paffenbarger RS, Clark DG, Cooper KH, Gibbons LW. Physical fitness and all-cause mortality. A prospective study of healthy men and women. JAMA. 1989;262(17):2395–2401. - PubMed
LinkOut - more resources
Full Text Sources
