. 2024 Sep 12;20(9):e1012517.
doi: 10.1371/journal.ppat.1012517. eCollection 2024 Sep.

α-Synuclein strain propagation is independent of cellular prion protein expression in a transgenic synucleinopathy mouse model

Affiliations

α-Synuclein strain propagation is independent of cellular prion protein expression in a transgenic synucleinopathy mouse model

Raphaella W L So et al. PLoS Pathog. .

Abstract

The cellular prion protein, PrPC, has been postulated to function as a receptor for α-synuclein, potentially facilitating cell-to-cell spreading and/or toxicity of α-synuclein aggregates in neurodegenerative disorders such as Parkinson's disease. Previously, we generated the "Salt (S)" and "No Salt (NS)" strains of α-synuclein aggregates that cause distinct pathological phenotypes in M83 transgenic mice overexpressing A53T-mutant human α-synuclein. To test the hypothesis that PrPC facilitates the propagation of α-synuclein aggregates, we produced M83 mice that either express or do not express PrPC. Following intracerebral inoculation with the S or NS strain, the absence of PrPC in M83 mice did not prevent disease development and had minimal influence on α-synuclein strain-specified attributes such as the extent of cerebral α-synuclein deposition, selective _targeting of specific brain regions and cell types, the morphology of induced α-synuclein deposits, and the structural fingerprints of protease-resistant α-synuclein aggregates. Likewise, there were no appreciable differences in disease manifestation between PrPC-expressing and PrPC-lacking M83 mice following intraperitoneal inoculation of the S strain. Interestingly, intraperitoneal inoculation with the NS strain resulted in two distinct disease phenotypes, indicative of α-synuclein strain evolution, but this was also independent of PrPC expression. Overall, these results suggest that PrPC plays at most a minor role in the propagation, neuroinvasion, and evolution of α-synuclein strains in mice that express A53T-mutant human α-synuclein. Thus, other putative receptors or cell-to-cell propagation mechanisms may have a larger effect on the spread of α-synuclein aggregates during disease.


Conflict of interest statement

The authors have declared that no competing interests exist.

Figures

Fig 1
Fig 1. Intracerebral inoculation of M83-Prnp+/+ and M83-Prnp0/0 mice with the S and NS strains.
A) Immunoblot for PrPC in brain extracts from 18-month-old uninoculated M83-Prnp+/+ and M83-Prnp0/0 mice (2 independent mice per line). The blot was reprobed with an actin antibody. B) Immunoblots for mouse α-syn, human α-syn, and total (mouse + human) α-syn in brain extracts from 18-month-old uninoculated M83-Prnp+/+ and M83-Prnp0/0 mice (2 independent mice per line). Each blot was reprobed with an actin antibody. C) ELISA results for human α-syn in brain extracts from 18-month-old uninoculated M83-Prnp+/+ (n = 3) and M83-Prnp0/0 (n = 5) mice. The graph displays mean ± s.e.m. Statistical significance was assessed using a Mann-Whitney test. D) Schematic of intracerebral inoculation experiments in M83-Prnp+/+ and M83-Prnp0/0 mice. The schematic was created using BioRender.com. E) Kaplan-Meier survival curves for M83-Prnp+/+ and M83-Prnp0/0 mice inoculated intracerebrally with S or NS strain (n = 5–9 mice per experimental condition). Statistical significance was assessed using the Log-rank test.
Fig 2
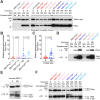
Fig 2. PrPC does not affect the biochemical attributes of the S and NS strains following intracerebral inoculation of M83 mice.
A) Immunoblots of detergent-insoluble α-syn in brain extracts from symptomatic M83-Prnp+/+ and M83-Prnp0/0 mice at the indicated days post-inoculation (DPI) with S or NS strain compared with 18-month-old uninoculated (—) mice, probed for total α-syn and PSyn. In the left blots, one mouse is shown for each experimental condition. In the right blots, two distinct mice per experimental condition are shown, along with their respective inocula. B) Quantification of detergent-insoluble PSyn levels in brain extracts from the 4 experimental groups (n = 5–9 mice per experimental condition). The graph displays mean ± s.e.m. Statistical significance was assessed using a Kruskal-Wallis test followed by Dunn’s multiple comparisons test. C) Pooled detergent-insoluble PSyn data for M83-Prnp+/+ and M83-Prnp0/0 mice inoculated with either S (n = 13) or NS (n = 17) strain. The graph displays mean ± s.e.m. Statistical significance was assessed using a Mann-Whitney test. D) Immunoblots of detergent-insoluble PSyn in brain extracts from uninoculated, S-inoculated, and NS-inoculated M83-Prnp+/+ and M83-Prnp0/0 mice after thermolysin (TL) digestion, as well as detergent-insoluble total α-syn after proteinase K (PK) digestion. E) Immunoblots for detergent-insoluble TL-resistant PSyn and PK-resistant total α-syn in the S and NS inocula used for the intracerebral inoculations. F) Immunoblots for detergent-insoluble TL-resistant PSyn and PK-resistant total α-syn in brain extracts from symptomatic S- or NS-inoculated M83-Prnp+/+ and M83-Prnp0/0 mice at the indicated DPI. Two distinct mice are shown per experimental condition.
Fig 3
Fig 3. PrPC does not affect the cerebral deposition of α-syn aggregates following intracerebral inoculation of M83 mice with the S and NS strains.
A) Representative images of PSyn-stained sections from the pons, midbrain, and hypothalamus of 18-month-old uninoculated M83-Prnp+/+ and M83-Prnp0/0 mice as well as symptomatic mice inoculated intracerebrally with the S or NS strains. Scale bar = 50 μm. B) Quantification of the area covered by PSyn staining in sections from the indicated brain regions of symptomatic M83-Prnp+/+ and M83-Prnp0/0 mice inoculated with either S or NS (n = 5–9 mice per experimental condition). The graph displays mean ± s.e.m. Statistical significance was assessed using two-way ANOVA. C) Pooled quantitative PSyn staining data for M83-Prnp+/+ and M83-Prnp0/0 mice inoculated with either S (n = 13) or NS (n = 17) strain. Data from uninoculated mice (n = 7) is also shown. The graph displays mean ± s.e.m. Statistical significance was assessed using two-way ANOVA.
Fig 4
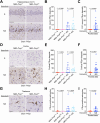
Fig 4. PrPC does not affect the selective _targeting of distinct brain regions and cell types by α-syn strains in M83 mice.
A, D) Representative images of PSyn-stained sections from the hippocampal CA1 region (A) or cortex (D) from symptomatic M83-Prnp+/+ and M83-Prnp0/0 mice inoculated intracerebrally with the S or NS strains. Scale bar = 50 μm. B, E) Quantification of the number of PSyn-positive neurons in the hippocampal CA1 region (B) or cortex (E) of inoculated mice (n = 5–9 mice per experimental condition). C, F) Pooled PSyn-positive neuronal counts in the hippocampal CA1 region (C) or cortex (F) of M83-Prnp+/+ and M83-Prnp0/0 mice inoculated with either S (n = 13) or NS (n = 17) strain. G) Representative images of PSyn-stained sections from the thalamus of symptomatic M83-Prnp+/+ and M83-Prnp0/0 mice inoculated with the NS strain. Scale bar = 20 μm. H) Quantification of the number of PSyn-positive astrocytes in the thalamus of S- or NS-inoculated mice (n = 5–9 mice per experimental condition). I) Pooled PSyn-positive astrocyte counts in the thalamus of M83-Prnp+/+ and M83-Prnp0/0 mice inoculated with either S (n = 13) or NS (n = 17) strain. All graphs display mean ± s.e.m. In panels B, E, and H, statistical significance was assessed using a Kruskal-Wallis test followed by Dunn’s multiple comparisons test. In panels C, F, and I, statistical significance was assessed using a Mann-Whitney test.
Fig 5
Fig 5. PrPC does not affect α-syn strain-specified differences in the morphology of induced α-syn aggregates in M83 mice.
A) Representative images of PSyn-stained sections from the midbrain of symptomatic M83-Prnp+/+ and M83-Prnp0/0 mice inoculated intracerebrally with the S or NS strains. Scale bar = 10 μm. B) Quantification of the relative percentages of ring-like and LB-like PSyn inclusions in the midbrain of S- or NS-inoculated mice (n = 5–9 mice per experimental condition). The graph displays mean ± s.e.m. Statistical significance was assessed using two-way ANOVA.
Fig 6
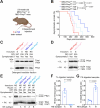
Fig 6. Intraperitoneal inoculation of M83-Prnp+/+ and M83-Prnp0/0 mice with the S and NS strains.
A) Schematic of intraperitoneal inoculation experiments in M83-Prnp+/+ and M83-Prnp0/0 mice. The schematic was created using BioRender.com. B) Kaplan-Meier survival curves for M83-Prnp+/+ and M83-Prnp0/0 mice inoculated intraperitoneally with S or NS strain (n = 5–10 mice per experimental condition). Statistical significance was assessed using the Log-rank test. C) Immunoblots of detergent-insoluble α-syn in brain extracts from symptomatic M83-Prnp+/+ and M83-Prnp0/0 mice at the indicated DPI with S or NS strain, probed for total α-syn and PSyn. D) Immunoblots of detergent-insoluble TL-resistant PSyn in brain extracts from symptomatic M83-Prnp+/+ and M83-Prnp0/0 mice inoculated intraperitoneally with S strain, as well as detergent-insoluble PK-resistant total α-syn. E) Immunoblots for detergent-insoluble TL-resistant PSyn and PK-resistant total α-syn in brain extracts from symptomatic M83-Prnp+/+ and M83-Prnp0/0 mice inoculated intraperitoneally with NS strain. Brain extract from an M83-Prnp0/0 mouse inoculated intracerebrally with NS strain is shown for comparison. Based on banding patterns of protease-resistant α-syn, two different NS subtypes were identified following intraperitoneal inoculation. F) Quantification of band intensity ratios in PSyn immunoblots following TL digestion for mice exhibiting NS subtype A (n = 5) or NS subtype B (n = 6). Data for M83-Prnp+/+ (dark blue) and M83-Prnp0/0 (light blue) mice is pooled. G) Quantification of band intensity ratios in immunoblots for total α-syn following PK digestion for mice exhibiting the two NS subtypes. Data for M83-Prnp+/+ (dark blue) and M83-Prnp0/0 (light blue) mice is pooled. The graphs in panels F and G display mean ± s.e.m., and statistical significance was assessed using a Mann-Whitney test.
Fig 7
Fig 7. Neuropathology of M83-Prnp+/+ and M83-Prnp0/0 mice inoculated intraperitoneally with the S and NS strains.
A) Representative images of PSyn-stained sections from the pons, midbrain, and hypothalamus of symptomatic M83-Prnp+/+ and M83-Prnp0/0 mice inoculated intraperitoneally with the S or NS strains. Scale bar = 50 μm. B) Quantification of the area covered by PSyn staining in sections from the indicated brain regions of symptomatic M83-Prnp+/+ and M83-Prnp0/0 mice inoculated intraperitoneally with either S or NS (n = 5–10 mice per experimental condition). C) Pooled quantitative PSyn staining data for M83-Prnp+/+ and M83-Prnp0/0 mice inoculated intraperitoneally with S strain (n = 15) or exhibiting the NS subtype A (n = 5) or NS subtype B (n = 6) phenotype following intraperitoneal inoculation. D) Representative images of PSyn-stained sections from the midbrain of symptomatic M83-Prnp+/+ and M83-Prnp0/0 mice inoculated intraperitoneally with the S or NS strains. Scale bar = 10 μm. E) Quantification of the relative percentages of ring-like and LB-like PSyn inclusions in the midbrain of S- or NS-inoculated mice (n = 5–10 mice per experimental condition). F) Relative percentages of ring-like and LB-like PSyn inclusions in the midbrain for M83-Prnp+/+ (dark blue) and M83-Prnp0/0 mice (light blue) exhibiting the NS subtype A (n = 5) or NS subtype B (n = 6) phenotype following intraperitoneal inoculation. The graphs in panels B, C, E, and F display mean ± s.e.m., and statistical significance was assessed using two-way ANOVA.

Similar articles

References

    1. Spillantini MG, Schmidt ML, Lee VM, Trojanowski JQ, Jakes R, Goedert M. Alpha-synuclein in Lewy bodies. Nature. 1997;388(6645):839–40. doi: 10.1038/42166 - DOI - PubMed
    1. Spillantini MG, Goedert M. The alpha-synucleinopathies: Parkinson’s disease, dementia with Lewy bodies, and multiple system atrophy. Ann N Y Acad Sci. 2000;920:16–27. doi: 10.1111/j.1749-6632.2000.tb06900.x - DOI - PubMed
    1. Burre J, Sharma M, Tsetsenis T, Buchman V, Etherton MR, Sudhof TC. Alpha-synuclein promotes SNARE-complex assembly in vivo and in vitro. Science. 2010;329(5999):1663–7. doi: 10.1126/science.1195227 - DOI - PMC - PubMed
    1. Fujiwara H, Hasegawa M, Dohmae N, Kawashima A, Masliah E, Goldberg MS, et al.. alpha-Synuclein is phosphorylated in synucleinopathy lesions. Nat Cell Biol. 2002;4(2):160–4. doi: 10.1038/ncb748 - DOI - PubMed
    1. Lashuel HA, Overk CR, Oueslati A, Masliah E. The many faces of alpha-synuclein: from structure and toxicity to therapeutic _target. Nat Rev Neurosci. 2013;14(1):38–48. doi: 10.1038/nrn3406 - DOI - PMC - PubMed

Grants and funding

This work was supported by grants to JCW from the Scottish Rite Charitable Foundation of Canada (#18119) (https://srcf.ca/) and the Canadian Institutes of Health Research (PJT-169042) (https://cihr-irsc.gc.ca/). The funders played no role in the study design, data collection and analysis, decision to publish, or preparation of the manuscript.

LinkOut - more resources

  NODES
twitter 2