. 2024 Sep 17;15(1):8161.
doi: 10.1038/s41467-024-52395-2.

Viral gene drive spread during herpes simplex virus 1 infection in mice

Affiliations

Viral gene drive spread during herpes simplex virus 1 infection in mice

Marius Walter et al. Nat Commun. .

Abstract

Gene drives are genetic modifications designed to propagate efficiently through a population. Most applications rely on homologous recombination during sexual reproduction in diploid organisms such as insects, but we recently developed a gene drive in herpesviruses that relies on co-infection of cells by wild-type and engineered viruses. Here, we report on a viral gene drive against human herpes simplex virus 1 (HSV-1) and show that it propagates efficiently in cell culture and during HSV-1 infection in mice. We describe high levels of co-infection and gene drive-mediated recombination in neuronal tissues during herpes encephalitis as the infection progresses from the site of inoculation to the peripheral and central nervous systems. In addition, we show evidence that a superinfecting gene drive virus could recombine with wild-type viruses during latent infection. These findings indicate that HSV-1 achieves high rates of co-infection and recombination during viral infection, a phenomenon that is currently underappreciated. Overall, this study shows that a viral gene drive could spread in vivo during HSV-1 infection, paving the way toward therapeutic applications.


Conflict of interest statement

A patent application describing the use of a gene drive in DNA viruses has been filed by the Buck Institute for Research on Aging (Application number 17054760, inventor: M.W.). The authors declare no further competing interests.

Figures
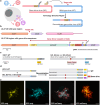
Fig. 1
Fig. 1. Design of a viral gene drive _targeting HSV-1 UL37-38 region.
a Gene drive viruses carry Cas9 and a gRNA _targeting the same location in a wild-type genome. After coinfection of cells by wild-type (WT) and gene drive (GD) viruses, Cas9 cleaves the wild-type sequence and homology-directed repair –using the gene drive sequence as a repair template– causes the conversion of the wild-type locus into a new gene drive sequence and the formation of new recombinant gene drive viruses (rGD). Artwork was modified from ref. , . b Modified and unmodified UL37-38 region. The gene drive cassette was inserted between the UL37 and UL38 viral genes and was composed of spCas9 under the control of a CBH promoter followed by the SV40 polyA signal, a CMV promoter driving an mCherry reporter, followed by the beta-globin polyA signal, and a U6-driven gRNA. c Localizations of the gene drive sequence and YFP/CFP reporters on HSV-1 genomes. GD represents a functional gene drive virus, GD-ns carries a non-specific gRNA, and Cas9 is deleted in GD-ΔCas9. UL/US: unique long/short genome segments. d, e Recombination products and examples of viral plaques after cellular co-infection with HSV1-WT expressing YFP and gene drive viruses expressing mCherry and CFP. Representative images from more than n > 10 experiments. Scale bars: 100 μm.
Fig. 2
Fig. 2. Gene drive spread in cell culture.
a Viral titers in the supernatant after infection of N2a cells with WT, GD, GD-ns or GD-ΔCas9. Cells were infected with a single virus at MOI = 1. n = 4. b, c Viral titers in the supernatant after co-infection of N2a cells with WT + GD, WT + GD-ns or WT + GD-ΔCas9, with a starting proportion of gene drive virus of 20% (b) or 40% (c). MOI = 1, n = 4. dg Evolution of the viral population after co-infection with WT + GD, WT + GD-ns or WT + GD-ΔCas9, with a starting proportion of gene drive virus of 20% (d, e) or 40% (f, g). Panels (d and f) show the proportion of viruses expressing mCherry, representing gene drive virus. Panels (e and g) show the proportion of viruses expressing the different fluorophore combinations. Viral titers are expressed in log-transformed PFU (plaque-forming unit) per mL of supernatant. Error bars represent the standard error of the mean (SEM) between biological replicates. n = 4. Source data are provided as a Source Data file.
Fig. 3
Fig. 3. Gene drive spread during herpes simplex encephalitis.
a Infection routes along the optic, oculomotor and trigeminal nerves (cranial nerves II, III and V, respectively) following ocular inoculation of HSV-1. Male and female Balb/c mice were infected with 106 PFU in the left eye. b, c Viral titers after four days in the eye, TG and whole brain after (b) infection with a single virus, n = 5 mice, or (c) with a starting proportion of gene drive virus of 15%, n = 6 mice. d, e Viral population in the eye, TG and whole brain after co-infection with WT + GD or WT + GD-ns, after four days. n = 6. f Proportion of viral genomes with a mutated _target site in the brain after four days. n = 3. g Viral titers in the spinal cord and brain after inoculation of WT, WT + GD, or WT + GD-ns in the right hind leg footpad, after 5–7 days. n = 8 for WT and WT + GD, n = 4 for WT + GD-ns. h, i Viral population in the spinal cord and whole brain after co-infection with WT + GD or WT + GD-ns, after 5–7 days. n = 5 for WT + GD, n = 1 for WT + GD-ns. Viral titers are expressed in log-transformed PFU. In panels (b, c and g) black lines indicate the median. n.d.: non-detected. Panels (d, e, f, h, and i) show the average and SEM between biological replicates. Source data are provided as a Source Data file.
Fig. 4
Fig. 4. High heterogeneity between brain regions during gene drive spread.
a Infection routes following ocular inoculation of HSV-1. Male and female Balb/c mice were co-infected with 106 PFU of WT + GD in the left eye, with a starting proportion of gene drive virus of 15%. b Viral titers over time. Black lines indicate the median. n.d.: non-detected. c, d Proportion of gene drive viruses over time. Data show the average and SEM between biological replicates. e Heatmap summarizing panels (b and c). n = 4 mice for day 2 and 3, n = 6 mice for day 4. Source data are provided as a Source Data file.
Fig. 5
Fig. 5. High levels of co-infection in the TG during HSV-1 infection.
a Balb/c mice were co-infected with equivalent amounts of three viruses expressing YFP, CFP and RFP, respectively, with a total of 106 PFU in the left eye. b. YFP and CFP cellular intensity after machine learning-assisted cell segmentation of TG sections. Datapoints represent individual cells and were colored by converting YFP and CFP signals into the CYMK color space. 4035 cells were detected, originating from 53 images and n = 4 mice. c Percentage of infected cells expressing YFP, CFP, or both. n = 4 mice. d Percentage of infected cells expressing one or two fluorescent markers. n = 4 mice. e, f Representative images of TG sections from four biological replicates, highlighting high levels of co-infection. Arrows indicate cells co-expressing YFP, CFP and RFP together. Scale bars: 100 μm. Panels (c and d) show the average and standard deviation (SD) between biological replicates. Source data are provided in Supplementary data 2 and as a Source Data file.
Fig. 6
Fig. 6. High levels of co-infection in the brain during HSV-1 infection.
a Images of brain sections were collected in three regions in the thalamus, midbrain and brain stem after ocular infection. b YFP, CFP and RFP cellular intensity after machine learning-assisted cell segmentation of brain sections. Datapoints were colored by converting YFP, CFP and RFP signals into the CYMK color space. 10,028 cells were detected, originating from 95 images and n = 3 mice. c Percentage of infected cells expressing one, two, or three fluorescent markers, both in the whole brain and in specific subregions. n = 3 mice. Data show the average and SD between biological replicates. d Representative images of the brain in the thalamus (sections S1), midbrain (sections S2) and brain stem (section S3), from three biological replicates. eh Representative images and summary of co-infection patterns in specific subregions. LGN: lateral geniculate nucleus; SC: superior colliculus; EW: Edinger–Westphal nucleus; TGN: trigeminal nerve nuclei. Scale bars: 100 μm. Source data are provided in Supplementary data 2 and as a Source Data file.
Fig. 7
Fig. 7. Co-infection levels in the retina and ciliary ganglion during HSV-1 infection.
a Following intravitreal inoculation, HSV-1 principally infects the retina and other ocular tissues such as the cornea, before invading the peripheral and central nervous system. In particular, HSV-1 infects the ciliary ganglion (CG) before propagating to the midbrain through the oculomotor nerve. b Representative image of an infected eye, showing infected cells in the retina, cornea and CG. The boxed area is shown in panel (c). c Representative image of the retina. Despite the high background fluorescence in the CFP and RFP channels, viruses expressing YFP, CFP and RFP appear restricted to non-overlapping areas. d Representative image of the ciliary ganglion (CG), showing high levels of co-infection. The CG was identified as a small structure close to the optic nerve in the posterior region of the eye, with clear fluorescent signals similar to other neuronal tissues in the TG or the brain. e YFP, CFP and RFP intensity in the CG after machine learning-assisted cell segmentation. 222 cells originating from 4 images and n = 2 mice. f Percentage of infected cells expressing one, two, or three fluorescent markers in the CG. n = 2. Scale bars: 100 μm. In panels (b, c, and d,) images are representative images from two biological replicates. Source data are provided in Supplementary data 2 and as a Source Data file.
Fig. 8
Fig. 8. Gene drive spread during latent infection in Swiss-Webster mice.
a Experimental outline: Swiss-Webster mice were infected with 105 PFU of HSV1-WT on both eyes after corneal scarification. Four weeks later, mice were superinfected with 107 PFU of GD or GD-ns on both eyes, after corneal scarification. Another four weeks later, latent HSV-1 was reactivated twice with JQ1, two weeks apart. n = 14 mice per group. b Titer and number of shedding events in eye swabs on days 1–3 following JQ1 treatment, by qPCR. Shedding events from the same mouse are connected by a line. c Genotyping of positive eye swabs from five mice, using two duplex ddPCR assays. The first assay detected and quantified mCherry levels. The second assay distinguished between YFP and CFP. n = 8. d Number and proportion of TG and mice with detectable CFP. e Latent viral load in the TG by duplex ddPCR, detecting mCherry, YFP, CFP markers, or all HSV sequences. n = 28. f Proportion of CFP and mCherry in the TG. n = 28. Titers are expressed in log-transformed copies per swab, or per million cells after normalization with mouse RPP30 levels. Black lines indicate the median. n.d.: non-detected. Source data are provided as a Source Data file.
Fig. 9
Fig. 9. Gene drive spread during latent infection in C57Bl/6 mice.
C57Bl/6 mice were infected with 106 PFU of HSV1-WT on both eyes after corneal scarification. Four weeks later, mice were superinfected with 107 PFU of GD or GD-ns on both eyes, after corneal scarification. After another four weeks, latent HSV-1 was reactivated three times, two weeks apart, with JQ1 and Buparlisib. n = 26 for GD, n = 18 for GD-ns. a Titer and number of shedding events in eye swabs on days 1–3 following JQ1 treatment, by qPCR. Shedding events from the same mouse are connected by a line. b Genotyping of positive eye swabs, detecting mCherry, YFP and CFP markers. Light red indicates low mCherry levels, less than 5% of the total swab titer. Swab genotypes were assessed by ddPCR and confirmed by qPCR for low-titer swabs. Details are shown in Supplementary Fig. 14. c Number and proportion of TG and mice with detectable CFP marker from GD/GD-ns. d, e Latent viral load and proportion in the TG. n = 52 for GD, n = 36 for GD-ns. Black lines indicate the median. f mCherry as a function of CFP. Data was fitted either to the best possible line or to the identity line, and the fits were compared using the extra sum-of-squares F test. GD datapoints were significantly higher than the identity line (p < 0.0001), suggesting gene drive propagation in the TG. Same data as panel (d), excluding non-detected samples. n = 38 for GD, n = 23 for GD-ns. g Log2 fold-change between the proportion of latent mCherry and CFP, using data from panel (e). Samples with low levels of less than 0.5% were excluded. Black lines show the average. Asterisks summarize the results of two-sided Welch’s t-test (p = 0.0053). n = 33 for GD, n = 20 for GD-ns. Titers are expressed in log-transformed copies per swab, or per million cells after normalization with mouse RPP30. n.d.: non-detected. Source data are provided as a Source Data file.

Similar articles

References

    1. Berrington, W. R. et al. Clinical correlates of herpes simplex virus viremia among hospitalized adults. Clin. Infect. Dis.49, 1295–1301 (2009). - PMC - PubMed
    1. Brown, E. L. et al. Effect of maternal herpes simplex virus (HSV) serostatus and HSV type on risk of neonatal herpes. Acta Obstet. Gynecol. Scand.86, 523–529 (2007). - PubMed
    1. Freeman, E. E. et al. Herpes simplex virus 2 infection increases HIV acquisition in men and women: systematic review and meta-analysis of longitudinal studies. AIDS20, 73–83 (2006). - PubMed
    1. Tanner, E. J., Kirkegaard, K. A. & Weinberger, L. S. Exploiting genetic interference for antiviral therapy. PLoS Genet12, e1005986 (2016). - PMC - PubMed
    1. Chaturvedi, S. et al. Identification of a therapeutic interfering particle—a single-dose SARS-CoV-2 antiviral intervention with a high barrier to resistance. Cell184, 6022–6036 (2021). - PMC - PubMed

LinkOut - more resources

  NODES
chat 1
twitter 2