. 2024 Sep 18;19(9):e0309893.
doi: 10.1371/journal.pone.0309893. eCollection 2024.

_targeting ferroptosis with the lipoxygenase inhibitor PTC-041 as a therapeutic strategy for the treatment of Parkinson's disease

Affiliations

_targeting ferroptosis with the lipoxygenase inhibitor PTC-041 as a therapeutic strategy for the treatment of Parkinson's disease

Angela Minnella et al. PLoS One. .

Abstract

Parkinson's disease is the second most common neurodegenerative disorder, affecting nearly 10 million people worldwide. Ferroptosis, a recently identified form of regulated cell death characterized by 15-lipoxygenase-mediated hydroperoxidation of membrane lipids, has been implicated in neurodegenerative disorders including amyotrophic lateral sclerosis and Parkinson's disease. Pharmacological inhibition of 15 -lipoxygenase to prevent iron- and lipid peroxidation-associated ferroptotic cell death is a rational strategy for the treatment of Parkinson's disease. We report here the characterization of PTC-041 as an anti-ferroptotic reductive lipoxygenase inhibitor developed for the treatment of Parkinson's disease. In these studies, PTC-041 potently protects primary human Parkinson's disease patient-derived fibroblasts from lipid peroxidation and subsequent ferroptotic cell death and prevents ferroptosis-related neuronal loss and astrogliosis in primary rat neuronal cultures. Additionally, PTC-041 prevents ferroptotic-mediated α-synuclein protein aggregation and nitrosylation in vitro, suggesting a potential role for anti-ferroptotic lipoxygenase inhibitors in mitigating pathogenic aspects of synucleinopathies such as Parkinson's disease. We further found that PTC-041 protects against synucleinopathy in vivo, demonstrating that PTC-041 treatment of Line 61 transgenic mice protects against α-synuclein aggregation and phosphorylation as well as prevents associated neuronal and non-neuronal cell death. Finally, we show that. PTC-041 protects against 6-hydroxydopamine-induced motor deficits in a hemiparkinsonian rat model, further validating the potential therapeutic benefits of lipoxygenase inhibitors in the treatment of Parkinson's disease.


Conflict of interest statement

I have read the journal’s policy, and the authors of this manuscript have the following competing interests: AA, AM, JCL, KPM, MW, SO, JKT, and MBK are employees of PTC Therapeutics, Inc., a biotechnology company. In connection with such employment, the authors receive salary, benefits and stock-based compensation, including stock options, restricted stock, other stock-related grants, and the right to purchase discounted stock through PTC’s employee stock purchase plan. All other authors, RKW, declared no competing interests for this work. This does not alter our adherence to PLOS ONE policies on sharing data and materials.

Figures

Fig 1
Fig 1. The role of lipoxygenase enzymes as key regulators in ferroptotic cell death.
Lipoxygenase (LO) enzymes oxidize free- and membrane-bound polyunsaturated fatty acids into an array of lipid species, which are further enzymatically transformed into many lipid signaling molecules [15]. Leukotrienes, prostaglandins, hydroxyeicosatetraenoic acids (HETEs), and thromboxanes are all formed from arachidonic acid. Hydroperoxyeicosatetraenoic acids (HpETEs), the precursors of HETEs, are critically involved in ferroptotic cell death [–8]. Increased 15-LO activity leads to glutathione oxidation and depletion, neuroinflammation, protein aggregation, and, ultimately, ferroptotic cell death.
Fig 2
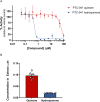
Fig 2. PTC-041 hydroquinone directly inhibits 15-lipoxygenase and is detected in primary rat neuron cultures.
(A) Human 15-LO activity measured by liquid chromatography with tandem mass spectrometry (LC-MS) utilizing arachidonic acid (10 μM) as substrate. Mean ± SD (n = 4) values are displayed. Similar results were observed with rabbit 15-LO enzyme. Concentrations of PTC-041 quinone and hydroquinone measured by succinate capping method using mass spectroscopy 4 hours after PTC-041 quinone administration (1 μM) in DIV4 primary cortical neuron co-cultures. Data are presented as mean ± SEM of n = 6 wells/condition.
Fig 3
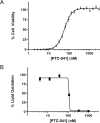
Fig 3. PTC-041 potently protects primary Parkinson’s disease patient-derived fibroblasts from ferroptotic lipid oxidation and cell death.
(A) Cell survival was assessed by CTG 2.0 assay 24 hours after RSL3 (2 μM) and concomitant PTC-041 treatment (24-point dose response). Summary results for 1 representative donor’s cells (ND40070) are shown as mean ± SEM of multiple replicates (n = 15) from 4 independent experiments. (B) Cell lipid oxidation was assessed by monitoring the rate of change in total green fluorescence area per well of BODIPY C11 581/591-prelabeled cells as measured over time in the IncuCyte S3 instrument. Five hours after RSL3 (2 μM) and concomitant compound treatment (6-point dose response in experimental triplicate), the rescue potency was evaluated.
Fig 4
Fig 4. PTC-041 prevents 15-HETE release from RSL3-treated PD patient-derived fibroblasts.
Patient-derived fibroblasts [(A) donor ND40070; (B) donor ND33424] were treated with RSL3 (2 μM) with or without concomitant PTC-041 treatment (ND40070, 700 nM; ND33424, 300 nM). After 5.5 to 6 hours of treatment, the cellular conditioned medium was collected and 15-, 5-, or 12-HETE or AA was quantitated using _targeted LC-MS methods. Note that the cognate hydroperoxidated (HpETE) species were also analyzed but were below the limits of quantitation for >90% of the samples, preventing further analysis. Results shown are from 1 experiment per cell type, in which 6 independently treated wells were analyzed by LC-MS separately, with each LC-MS sample being analyzed in singlicate. Mean ± SD (n = 6) values are displayed. Statistical test applied: 1-way ANOVA compared to the RSL3-only group, with Dunnett’s test for multiple comparisons, where **** = p<0.0001, *** = p≤0.001, ** = p≤0.01, * = p≤0.05, and ns = p>0.05.
Fig 5
Fig 5. PTC-041 prevents ferroptosis but not other forms of regulated cell death.
(A) Q7 cells were incubated for 15 minutes with PTC-041, ferrostatin-1 (inhibitor of ferroptosis), Z-VAD-FMK (inhibitor of apoptosis), necrostatin-1 (inhibitor of necroptosis), and bafilomycin A1 (autophagy inhibitor) at the concentrations indicated. Ferroptosis was induced with RSL3 (2 μM). Cells were incubated for 18 hours, and cell viability was assessed. Representative trace of 3 independent experiments. The EC50 values for cell viability were 37.21, 51.52, and 30.88 nM (PTC-041) and 37.01, 44.54, and 28.61 nM (ferrostatin-1). (B) Q7 cells were incubated for 15 minutes with PTC-041, ferrostatin-1 (inhibitor of ferroptosis), Z-VAD-FMK (inhibitor of apoptosis), and necrostatin-1 (inhibitor of necroptosis) at various concentrations. Caspase activation was induced with staurosporine (1 μM). Cells were incubated for 6 hours and caspase activity was assessed. Traces show representative of 5 independent experiments conducted.
Fig 6
Fig 6. PTC-041 prevents neurite loss in primary rat midbrain neurons and prolongs neurite protection in response to RSL3 challenge.
(A) Total neurite (MAP2) integrity was quantified with the ArrayScan XTI high-content imaging platform (ThermoFisher). Representative images for 1000 nM PTC-041 are shown. (B) Ferroptotic cell death was induced in primary rat midbrain neuronal cultures 24 hours after plating (DIV1) with the GPX4 inhibitor RSL3 (1.25 μM). Total neurite length was quantified over time with the IncuCyte platform. (C) Prolonged total neurite protection was observed on treatment with PTC-041 (300 nM). Neurite protection EC50 values were estimated at 24 hours after the onset of RSL3-induced neurite injury. All data are presented as mean ± SEM of n = 6 wells/condition.
Fig 7
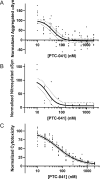
Fig 7. PTC-041 inhibits RSL3-induced α-synuclein aggregation and nitrosylation.
(A) Aggregation: Results are the average of 3 independent experiments. Data were expressed relative to the average of the RSL3-only control wells (100%) and dimethylsulfoxide (DMSO)-only control wells (0%). Each dot corresponds to 1 well. The top of the curve was constrained to 100. Solid line indicates best-fit curve; dotted lines represent 95% confidence intervals for best-fit curve. Best-fit values (95% confidence intervals): IC50, 43 nM (32 to 58 nM); Bottom, -5% (-15% to 5%); Hill slope, -2.2 (-3.9 to -1.3). (B) Nitrosylation: Results are the average of 2 independent experiments. Data were expressed relative to the average of the RSL3-only control wells (100%) and DMSO-only control wells (0%). Each dot corresponds to 1 well. The top of the curve was constrained to 100. Solid line indicates best-fit curve; dotted lines represent 95% confidence intervals for best-fit curve. Best-fit values (95% confidence intervals): IC50, 27 nM (16 to 43 nM); Bottom, 6% (-7% to 19%); Hill slope, not calculable. (C) Cytotoxicity: Results are the average from 3 independent experiments. Data were expressed relative to the average of the RSL3-only control wells (100%) and DMSO-only control wells (0%). Each dot corresponds to 1 well. Curve top was constrained to 100. Solid line indicates best-fit curve; dotted lines represent 95% confidence intervals for best-fit curve. Best-fit values (95% confidence intervals): IC50, 68 nM (55 to 87 nM); Bottom, 4% (-3% to 10%); Hill slope, -1.0 (-1.3 to -0.9).
Fig 8
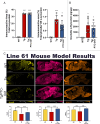
Fig 8. Treatment of Line 61 transgenic mice with PTC-041 results in attenuated α-synuclein pathology.
(A) Quantification of total and pSer129 α-synuclein immunofluorescence in the cerebral isocortex. Graphs present the means of immunofluorescent signal measured within the region of interest on 5 brain sections per mouse (n = 6 per group). Bar graphs represent group means ± SEM (n = 6 per group); ***p<0.0001. Data were analyzed by one-way analysis of variance (ANOVA) and Dunnett’s post hoc test for multiple comparisons; WT (Vehicle) group was defined as statistical control for comparisons. (B) Quantification of insoluble human α-synuclein levels in the cortex. Data are displayed as pg α-synuclein per μg total protein; bar graphs represent group means ± SEM (n = 6 per group); ***p<0.0001, **p<0.001, *p<0.05. Data were analyzed by one-way ANOVA and Dunnett’s post hoc test for multiple comparisons; WT (Vehicle) group was defined as statistical control for comparisons. (C) MALDI-IHC was used to image proteins in sagittal brain sections of wild-type (WT), Line 61 transgenic (Tg), and PTC-041-dosed transgenic (Tg + PTC-041) mice. Loss of neurons (NeuN ), non-neuronal cells expressing Glut1 (), and neurites expressing MAP2 () were also observed in Line 61 transgenic mice relative to WT, and PTC-041 was able to rescue this loss. Bar graphs represent means of MALDI-IHC signal measured ± SEM, n = 3; ***p<0.0001.
Fig 9
Fig 9. PTC-041 improves motor deficits caused by dopaminergic neuron loss.
6-OHDA lesion recapitulates the major aspects of the PD phenotype as measured by cylinder and rotation tests. (A) Cylinder test. 6-OHDA-lesioned animals demonstrate profound forelimb use asymmetry, with >80% preference for the ipsilateral paw indicating >95% dopaminergic neuron loss. Normal (yellow) represents the percentage of animals where scoring of forelimb usage was within 2 SD of the mean of the Sham group. Intermediate (blue) represents the percentage of animals that displayed preferential ipsilateral forepaw use between 2 SD and 3 SD above the mean of the Sham group. 100% ipsilateral usage (red) represents the percentage of animals that relied solely on their ipsilateral paw. (B) Apomorphine-induced rotation test. Based on the literature, an increase in contralateral rotations of more than 5 per minute is the minimum threshold indicating PD pathology [32]. Bars show the mean (± SEM) number of contralateral turns per minute for each group. Individual markers represent individual animal values.

Similar articles

References

    1. Feigin VL, Nichols E, Alam T, Bannick MS, Beghi E, Blake N, et al.. Global, regional, and national burden of neurological disorders, 1990–2016: a systematic analysis for the Global Burden of Disease Study 2016. The Lancet Neurology. 2019;18(5):459–80. doi: 10.1016/S1474-4422(18)30499-X - DOI - PMC - PubMed
    1. Van Den Eeden SK, Tanner CM, Bernstein AL, Fross RD, Leimpeter A, Bloch DA, Nelson LM. Incidence of Parkinson’s Disease: Variation by Age, Gender, and Race/Ethnicity. Am J Epidemiol. 2003;157(11):1015–22. doi: 10.1093/aje/kwg068 - DOI - PubMed
    1. Dorsey ER, Bloem BR. The Parkinson pandemic—a call to action. JAMA neurology. 2018;75(1):9–10. doi: 10.1001/jamaneurol.2017.3299 - DOI - PubMed
    1. Mari Z, Mestre TA. The disease modification conundrum in parkinson’s disease: failures and hopes. Frontiers in Aging Neuroscience. 2022;14. doi: 10.3389/fnagi.2022.810860 - DOI - PMC - PubMed
    1. Devos D, Hirsch E, Wyse R. Seven solutions for neuroprotection in Parkinson’s disease. Movement Disorders. 2021;36(2):306–16. doi: 10.1002/mds.28379 - DOI - PubMed

MeSH terms

Grants and funding

The author(s) received no specific funding for this work.
  NODES
admin 1
Note 1
twitter 2