. 2024 Sep 21;14(9):1191.
doi: 10.3390/biom14091191.

USP18 Is Associated with PD-L1 Antitumor Immunity and Improved Prognosis in Colorectal Cancer

Affiliations

USP18 Is Associated with PD-L1 Antitumor Immunity and Improved Prognosis in Colorectal Cancer

Cili Jifu et al. Biomolecules. .

Abstract

Background: Compared with conventional chemotherapy and _targeted therapy, immunotherapy has improved the treatment outlook for a variety of solid tumors, including lung cancer, colorectal cancer (CRC), and melanoma. However, it is effective only in certain patients, necessitating the search for alternative strategies to _targeted immunotherapy. The deubiquitinating enzyme USP18 is known to play an important role in various aspects of the immune response, but its role in tumor immunity in CRC remains unclear.

Methods: In this study, multiple online datasets were used to systematically analyze the expression, prognosis, and immunomodulatory role of USP18 in CRC. The effect of USP18 on CRC was assessed via shRNA-mediated knockdown of USP18 expression in combination with CCK-8 and colony formation assays. Finally, molecular docking analysis of USP18/ISG15 and programmed death-ligand 1 (PD-L1) was performed via HDOCK, and an ELISA was used to verify the potential of USP18 to regulate PD-L1.

Results: Our study revealed that USP18 expression was significantly elevated in CRC patients and closely related to clinicopathological characteristics. The experimental data indicated that silencing USP18 significantly promoted the proliferation and population-dependent growth of CRC cells. In addition, high USP18 expression was positively correlated with the CRC survival rate and closely associated with tumor-infiltrating CD8+ T cells and natural killer (NK) cells. Interestingly, USP18 was correlated with the expression of various chemokines and immune checkpoint genes. The results of molecular docking simulations suggest that USP18 may act as a novel regulator of PD-L1 and that its deficiency may potentiate the antitumor immune response to PD-L1 blockade immunotherapy in CRC.

Conclusions: In summary, USP18 shows great promise for research and clinical application as a potential _target for CRC immunotherapy.

Keywords: PD-L1; USP18; anticancer immunity; colorectal cancer; immune checkpoint genes; tumor immune microenvironment.


Conflict of interest statement

The authors declare that they have no conflicts of interest.

Figures
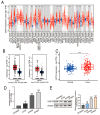
Figure 1
Figure 1
USP18 expression in colorectal cancer (CRC) samples from different databases. (A) The expression levels of USP18 in different cancer types in the TCGA database were analyzed via TIMER 2.0. (B) In the GEPIA database, USP18 was differentially expressed at different levels in colorectal adenocarcinoma (COAD) (n = 275), adjacent normal colon (n = 349), rectum adenocarcinoma (READ) (n = 92), and adjacent normal rectal (n = 318) tissues. (C) Differential USP18 expression in the GSE87211 dataset, with CRC tissues (n = 203) shown in red and adjacent normal tissues (n = 106) shown in blue. (D,E) Differences in the mRNA and protein levels of USP18 in NCM460, SW480, SW620, and HT29 cells were detected via qRT-PCR and Western blotting. Original blots/gels can be found at Supplementary figures. Representative data were collected from at least three independent experiments and are expressed as the means ± SD. ns, no significant difference, * p < 0.05, ** p  <  0.01, *** p  <  0.001.
Figure 2
Figure 2
Correlations of USP18 expression with clinicopathological data and prognosis in CRC patients. (A) Expression of USP18 across age groups in COAD patients: normal (n = 41), 21–40 years (n = 12), 41–60 years (n = 90), 61–80 years (n = 149), and 81–100 years (n = 32). (B) Expression of USP18 by gender in COAD patients: normal controls (n = 41), male patients (n = 156), and female patients (n = 127). (C) Expression of USP18 by histological subtype in COAD patients: normal (n = 41), adenocarcinoma (n = 243), and mucinous adenocarcinoma (n = 37). (D) Expression of USP18 based on nodal metastasis status in COAD patients: normal (n = 41), no metastasis (N0, n = 166), 1–3 involved lymph nodes (N1, n = 70), and 4 or more involved lymph nodes (N2, n = 47). (E) Expression of USP18 across age groups in READ patients: normal (n = 10), 21–40 years (n = 4), 41–60 years (n = 53), 61–80 years (n = 97), and 81–100 years (n = 11). (F) Expression of USP18 by gender in READ patients: normal controls (n = 10), male patients (n = 90), and female patients (n = 75). (G) Expression of USP18 by histological subtype in READ patients: normal (n = 10), adenocarcinoma (n = 146), and mucinous adenocarcinoma (n = 12). (H) Expression of USP18 based on nodal metastasis status in READ patients: normal (n = 10), no metastasis (N0, n = 84), 1–3 involved lymph nodes (N1, n = 45), and 4 or more involved lymph nodes (N2, n = 33). (I) Kaplan-Meier OS analysis for CRC patients with high vs. low expression of USP18: high expression (n = 837) and low expression (n = 899). (J) Kaplan-Meier PFS analysis for CRC patients with high vs. low expression of USP18: high expression (n = 162) and low expression (n = 432). Overall survival (OS), progression-free survival (PFS), hazard ratio (HR). * p <  0.05, ** p  <  0.01, *** p  <  0.001.
Figure 3
Figure 3
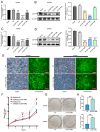
Effects of USP18 on CRC cell proliferation and colony formation. (AD) USP18-specific shRNAs (shUSP18#a, shUSP18#b, and shUSP18#c) significantly reduced the endogenous mRNA and protein levels of USP18 in SW480/SW620 cells. (E) Fluorescence microscopy images showing negative control (NC) and USP18-shRNA-transfected SW480/SW620 cells at 100× magnification, with shUSP18#b in SW480 cells and shUSP18#a in SW620 cells. (F) Proliferation of CRC cells was assessed using the CCK-8 assay. “*” indicates SW480 cells, and “#” indicates SW620 cells. shUSP18#b was applied to SW480 cells, and shUSP18#a was applied to SW620 cells. The assay was performed with 5 replicates per group, and data were collected from at least 3 independent experiments. (G) Results of the colony formation assay visualized with crystal violet staining 14 days postinoculation. (H) Statistical analysis of colony formation efficiency among the different experimental groups. Representative data were collected from at least three independent experiments and are expressed as the means ± SD. ns, no significant difference, * p  <  0.05, ** p  <  0.01, *** p  <  0.001; # p  <  0.05, ## p  <  0.01.
Figure 4
Figure 4
Enrichment maps from GSEA. (A) NK cell activity. (B) Antigen processing and presentation. (C) Hematopoietic cell lineage. (D) Toll-like receptor signaling. (E) T cell receptor signaling. (F) Chemokine signaling. (G) JAK-STAT signaling. (H) Cell adhesion molecules. (I,J) Changes in the relative expression of immune-related genes after USP18 knockdown (SW480-shUSP18#b and SW620-shUSP18#a) compared with negative controls (SW480-NC and SW620-NC). Gene expression levels are expressed as ddCT z-scores, n = 4 per group. Red indicates upregulation, and blue indicates downregulation. NES indicates the normalized enrichment score; FDR indicates the false discovery rate.
Figure 5
Figure 5
Correlation between USP18 and the tumor microenvironment. (A) Differences in the proportions of immune cells between the high-USP18 and low-USP18 groups. (BD) Correlations between USP18 expression and the abundances of activated CD8+ T cells (B), activated dendritic cells (C), and NK T cells (D) in COAD (n = 459). (EG) Correlations between USP18 expression and the abundances of activated CD8+ T cells (E), activated dendritic cells (F), and NK T cells (G) in READ patients (n = 167). (H) Comparison of TME scores between the high-USP18 and low-USP18 groups. The cell subpopulations were categorized into a high-USP18 group (orange) and a low-USP18 group (cyan) on the basis of USP18 expression levels. * p  <  0.05, ** p  <  0.01, *** p  <  0.001.
Figure 6
Figure 6
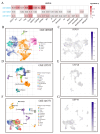
Correlation of USP18 with the TME in CRC according to the TISCH database. (A) Correlation of USP18 with the TME in CRC. (B,D,F) Annotation and distribution of immune cell types in the GSE108989 (n = 12), GSE139555 (n = 32), and GSE146771 (n = 20) datasets. (C,E,G) Proportion of USP18 among different immune cell types in the GSE108989, GSE139555, and GSE146771 datasets.
Figure 7
Figure 7
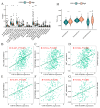
Association of USP18 with immune checkpoint genes. (A) Differential gene expression between the high USP18 expression group and the low USP18 expression group. (B) Correlations between USP18 and immune checkpoint inhibitory genes. (CH) Correlations between USP18 and the immunomodulatory factors PDCD1 (C), CXCL10 (D), CCL8 (E), CXCL11 (F), PD-L1 (G), CCL4 (H), CCL5 (I), and IL12RB1 (J).
Figure 8
Figure 8
USP18 may regulate PD-L1 expression. (A) Molecular docking modeling between ISG15 and PD-L1 using HDOCK. Red indicates the PD-L1 protein, and cyan indicates the ISG15 protein. (B) Diagram of the molecular docking model between USP18 and PD-L1. Red indicates the PD-L1 protein, and blue indicates USP18. (C,F) Expression of USP18 mRNA in CRC. (D,E,G,H) The expression of ISG15 and PD-L1 in CRC supernatants was measured via an ELISA. Representative data were collected from at least three independent experiments and are expressed as the means ± SD. * p <  0.05, ** p  <  0.01, *** p  <  0.001.

Similar articles

References

    1. GBD 2019 Colorectal Cancer Collaborators Global, regional, and national burden of colorectal cancer and its risk factors, 1990-2019: A systematic analysis for the Global Burden of Disease Study 2019. Lancet Gastroenterol. Hepatol. 2022;7:627–647. doi: 10.1016/S2468-1253(22)00044-9. - DOI - PMC - PubMed
    1. Biller L.H., Schrag D. Diagnosis and Treatment of Metastatic Colorectal Cancer: A Review. JAMA. 2021;325:669–685. doi: 10.1001/jama.2021.0106. - DOI - PubMed
    1. Ganesh K., Stadler Z.K., Cercek A., Mendelsohn R.B., Shia J., Segal N.H., Diaz L.A., Jr. Immunotherapy in colorectal cancer: Rationale, challenges and potential. Nat. Rev. Gastroenterol. Hepatol. 2019;16:361–375. doi: 10.1038/s41575-019-0126-x. - DOI - PMC - PubMed
    1. Nikolouzakis T.K., Chrysos E., Docea A.O., Fragkiadaki P., Souglakos J., Tsiaoussis J., Tsatsakis A. Current and Future Trends of Colorectal Cancer Treatment: Exploring Advances in Immunotherapy. Cancers. 2024;16:1995. doi: 10.3390/cancers16111995. - DOI - PMC - PubMed
    1. Ishida Y., Agata Y., Shibahara K., Honjo T. Induced expression of PD-1, a novel member of the immunoglobulin gene superfamily, upon programmed cell death. EMBO J. 1992;11:3887–3895. doi: 10.1002/j.1460-2075.1992.tb05481.x. - DOI - PMC - PubMed
  NODES
Association 3
Experiments 4
HOME 2
Interesting 1
Javascript 1
os 30
text 12
twitter 2
Verify 1
visual 1
web 4