. 2024 Oct 30;44(10):BSR20240449.
doi: 10.1042/BSR20240449.

Extracellular bimolecular fluorescence complementation for investigating membrane protein dimerization: a proof of concept using class B GPCRs

Affiliations

Extracellular bimolecular fluorescence complementation for investigating membrane protein dimerization: a proof of concept using class B GPCRs

Michael L Garelja et al. Biosci Rep. .

Abstract

Bimolecular fluorescence complementation (BiFC) methodology uses split fluorescent proteins to detect interactions between proteins in living cells. To date, BiFC has been used to investigate receptor dimerization by splitting the fluorescent protein between the intracellular portions of different receptor components. We reasoned that attaching these split proteins to the extracellular N-terminus instead may improve the flexibility of this methodology and reduce the likelihood of impaired intracellular signal transduction. As a proof-of-concept, we used receptors for calcitonin gene-related peptide, which comprise heterodimers of either the calcitonin or calcitonin receptor-like receptor in complex with an accessory protein (receptor activity-modifying protein 1). We created fusion constructs in which split mVenus fragments were attached to either the C-termini or N-termini of receptor subunits. The resulting constructs were transfected into Cos7 and HEK293S cells, where we measured cAMP production in response to ligand stimulation, cell surface expression of receptor complexes, and BiFC fluorescence. Additionally, we investigated ligand-dependent internalization in HEK293S cells. We found N-terminal fusions were better tolerated with regards to cAMP signaling and receptor internalization. N-terminal fusions also allowed reconstitution of functional fluorescent mVenus proteins; however, fluorescence yields were lower than with C-terminal fusion. Our results suggest that BiFC methodologies can be applied to the receptor N-terminus, thereby increasing the flexibility of this approach, and enabling further insights into receptor dimerization.

Keywords: Bimolecular Fluorescence Complementation; Calcitonin gene-related peptide; calcitonin receptor; dimerization; g protein-coupled receptors; receptor activity-modifying protein.


Conflict of interest statement

D.L.H. has received research support from AbbVie and Pfizer, and has acted as an advisor, speaker, or consultant for AbbVie, Amgen, Sosei-Heptares, Teva, and Eli Lilly. C.S.W. has received research support from AbbVie. The authors declare that there are no competing interests associated with the manuscript.

Pdf file detailing the DNA and amino acid sequences of constructs and oligonucleotides used in this paper, and Supplementary Figures including immunofluorescent images and signaling assays.

Calcitonin receptor: P30988. Calcitonin receptor-like receptor: Q16602. Receptor activity-modifying protein 1: O60894

Figures
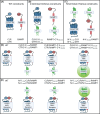
Figure 1
Figure 1. Fusion constructs and combinations for BiFC receptor testing
Schematic detailing the fusion constructs created and the combinations tested. (A) WT receptor constructs. (B) constructs in which the BiFC components have been fused to the intracellular C-termini of receptors. (C) constructs with the BiFC components fused to the extracellular N-termini of receptors. (D,E) outline the combinations of constructs tested and provide the naming convention used to refer to them throughout the paper. Images made using biorender.com.
Figure 2
Figure 2. Concentration-response curves for h-αCGRP-stimulated cAMP production at CGRP and AMY1 receptors in Cos7 cells
Results from CGRP or AMY1 receptors incorporating C-terminal (A–C), or N-terminal (D–F) mVenus BiFC fusion constructs in transiently transfected Cos7 cells (15-min stimulation duration). Each point is the mean ± s.e.m. of at least three independent experiments performed in duplicate or triplicate, for exact n numbers see Table 1. There is one additional experiment at CTR-C-V1–154 and N-V1–154-CTR in which αCGRP elicited a measurable curve, this has been excluded from the presented data set and is instead described in the legend of Table 1. Panels C and F present the same control CTR curve, however for ease of comparison we have presented this data in two panels.
Figure 3
Figure 3. Cell surface expression and mVenus fluorescence of CLR complexes in Cos7 cells
Detection and quantification of cell surface expression and mVenus fluorescence for CLR-based receptor complexes in transfected Cos7 cells. (A–C) are C-terminal fusion constructs, (D–F) are N-terminal fusion constructs. (A,D) Fluorescence results for antibody-based detection of AlexaFluor (AF)-568 and AF-647 (HA-tag and myc-tag, respectively), intrinsic mVenus fluorescence, and a cell marker (DAPI). AF channels are white, mVenus is yellow, and the cell marker (DAPI) is blue. Each column within a panel shows the same well and well position; all images within a panel are from the same independent experiment. Images are representative of six independent experiments performed in duplicate, triplicate, or quadruplicate. Each image is one field of view within a well, imaged at 20x. The brightness of images was modified to facilitate visualization on screen and in print; modifications were kept consistent within experiments and channels and care was taken during the acquisition process to make sure data did not saturate the detector. Scale bars indicate 50 µm. (B,C,E,F) quantified intensity of the HA (AF-568; B, E) or myc (AF-647; C, F) signal within each independent experiment. Each point is an independent experiment; lines indicate mean ± s.e.m. * indicates P < 0.05 compared with WT as determined by repeated measures one-way ANOVA with a post-hoc Dunnett's test comparing all conditions to WT.
Figure 4
Figure 4. Cell surface expression and mVenus fluorescence of CTR complexes in Cos7 cells
Detection and quantification of cell surface expression and mVenus fluorescence for CTR-based receptor complexes in transfected Cos7 cells. (A-C) are C-terminal fusion constructs, (D-F) are N-terminal fusion constructs. (A,D) Fluorescence results for antibody-based detection of AF-568 and AF-647 (HA-tag and myc-tag, respectively), intrinsic mVenus fluorescence, and a cell marker (DAPI). AF channels are white, mVenus is yellow, and the cell marker (DAPI) is blue. Each column within a panel shows the same well and well position, all images within a panel are from the same independent experiment. Images are representative of six independent experiments performed in duplicate, triplicate, or quadruplicate. Each image is one field of view within a well, imaged at 20x. The brightness of images was modified to facilitate visualization on screen and in print; modifications were kept consistent within experiments and channels and care was taken during the acquisition process to make sure data did not saturate the detector. Scale bars indicate 50 µm. (B,C,E,F) quantified intensity of the HA (AF-568; B, E) or myc (AF-647; C, F) signal within each independent experiment. Each point is an independent experiment; lines indicate mean ± s.e.m. * indicates p < 0.05 compared with WT as determined by repeated measures one-way ANOVA with a post-hoc Dunnett's test comparing all conditions to WT.
Figure 5
Figure 5. Quantification of mVenus fluorescence intensity for receptor fusions in HEK293S and Cos7 cells
Quantification of mVenus fluoroescence intensity for each receptor and fusion orientation in HEK293S and Cos7 cells. Each data point represents an independent experiment, with lines denoting the mean ± s.e.m. The fluorescence from C-terminal fusion was compared with N-terminal fusion fluorescence within cell-types using Student's t-tests; * indicates P < 0.05.
Figure 6
Figure 6. Detection and quantification of mVenus fluorescence in live and fixed HEK293S cells
Detection and quantification of mVenus fluorescence in live and fixed HEK293S cells. (A) Images are the same well before and after fixation and are representative of four independent experiments with duplicate technical replicates. In the images, the BiFC signal is presented in greyscale. The brightness of images was modified to facilitate viewing on screen and in print; modifications were kept consistent across all images. During acquisition, care was taken not to saturate detectors. Scale bars represent 100 µm. (B) Quantification of mVenus intensity in live and fixed cells. Background-corrected values were derived for presentation by subtracting the mean mVenus signal in the WT receptor wells from each other condition within the experiment. Each data point represents an independent experiment with lines indicating mean ± s.e.m. Intensity was compared by two-way repeated measures ANOVA with Fisher's LSD test, comparing fixed and live cells within and between fusion orientations. There was no significant difference between live and fixed cells within fusion orientations; in all cases C-terminal fusions resulted in a significantly greater intensity than N-terminal fusions (comparison not shown on graph).
Figure 7
Figure 7. Localization and quantification of [Cy5]-αCGRP in HEK293S cells over time
Localization and quantification of [Cy5]-αCGRP in HEK293S cells. (A) Localization of [Cy5]-αCGRP in HEK293S cells transfected with the WT CLR/RAMP1, C-terminal BiFC fusions, or N-terminal BiFC fusions across different time points. The Cy5 signal is white and DAPI is blue. Red-filled arrows indicate puncta formation, while black-filled arrows indicate binding to the cell surface. Scale bars indicate 100 µm. The brightness of images was modified to facilitate viewing on screen and in print; modifications were kept consistent across all images. During acquisition, care was taken not to saturate detectors. Scale bars represent 100 µm. (B) Quantification of puncta formation over time. Results from pcDNA-transfected wells are not included in this graph as results were normalized to the number of AF-568 positive cells in each image and as there were no cells expressing the HA-tag to detect, it was not possible to calculate a value. * indicates P < 0.05 compared with WT as determined by repeated measures one-way ANOVA with a post-hoc Dunnett's test comparing all conditions to WT at each time point. (C) Quantification of total Cy5 intensity as a proxy for ligand binding over time. There were no significant differences between receptor transfected conditions as determined by repeated measures one-way ANOVA with a post-hoc Dunnett's test comparing all conditions to WT.

Similar articles

References

    1. Hu C.D., Grinberg A.V. and Kerppola T.K. (2006) Visualization of protein interactions in living cells using bimolecular fluorescence complementation (BiFC) analysis. Curr. Protoc. Cell Biol. 29, 1–21Chapter 21:Unit 21 - PubMed
    1. Wouters E., Vasudevan L., Crans R.A.J., Saini D.K. and Stove C.P. (2019) Luminescence- and fluorescence-based complementation assays to screen for GPCR oligomerization: current state of the Art. Int. J. Mol. Sci. 20, e2958 10.3390/ijms20122958 - DOI - PMC - PubMed
    1. Vouri M., Croucher D.R., Kennedy S.P., An Q., Pilkington G.J. and Hafizi S. (2016) Axl-EGFR receptor tyrosine kinase hetero-interaction provides EGFR with access to pro-invasive signalling in cancer cells. Oncogenesis 5, e266 10.1038/oncsis.2016.66 - DOI - PMC - PubMed
    1. Tao R.H. and Maruyama I.N. (2008) All EGF(ErbB) receptors have preformed homo- and heterodimeric structures in living cells. J. Cell Sci. 121, 3207–3217 10.1242/jcs.033399 - DOI - PubMed
    1. Midde K.K., Aznar N., Laederich M.B., Ma G.S., Kunkel M.T., Newton A.C.et al. . (2015) Multimodular biosensors reveal a novel platform for activation of G proteins by growth factor receptors. Proc. Natl. Acad. Sci. U. S. A. 112, E937–E946 10.1073/pnas.1420140112 - DOI - PMC - PubMed

Publication types

MeSH terms

  NODES
Association 1
INTERN 2
twitter 2