. 2024 Aug 27;9(19):e181865.
doi: 10.1172/jci.insight.181865.

Spatiotemporally distinct roles of cyclooxygenase-1 and cyclooxygenase-2 at fetomaternal interface in mice

Affiliations

Spatiotemporally distinct roles of cyclooxygenase-1 and cyclooxygenase-2 at fetomaternal interface in mice

Shizu Aikawa et al. JCI Insight. .

Abstract

Embryo implantation is crucial for ensuring a successful pregnancy outcome and subsequent child health. The intrauterine environment during the peri-implantation period shows drastic changes in gene expression and cellular metabolism in response to hormonal stimuli and reciprocal communication with embryos. Here, we performed spatial transcriptomic analysis to elucidate the mechanisms underlying embryo implantation. Transcriptome data revealed that lipid metabolism pathways, especially arachidonic acid-related (AA-related) ones, were enriched in the embryo-receptive luminal epithelia. Cyclooxygenases (COXs), rate-limiting enzymes involved in prostaglandin production by AA, were spatiotemporally regulated in the vicinity of embryos during implantation, but the role of each COX isozyme in the uterus for successful pregnancy was unclear. We established uterine-specific COX2-knockout (uKO) and COX1/uterine COX2-double-KO (COX1/COX2-DKO) mice. COX2 uKO caused deferred implantation with failed trophoblast invasion, resulting in subfertility with reduced pregnancy rates and litter sizes. COX1/COX2 DKO induced complete infertility, owing to abrogated embryo attachment. These results demonstrate that both isozymes have distinct roles during embryo implantation. Spatial transcriptome and lipidome analyses revealed unique profiles of prostaglandin synthesis by each COX isozyme and spatiotemporal expression patterns of downstream receptors throughout the endometrium. Our findings reveal previously unappreciated roles of COXs at the fetomaternal interface to establish early pregnancy.

Keywords: Eicosanoids; Endocrinology; Reproductive biochemistry; Reproductive biology.


Figures
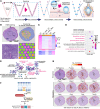
Figure 1
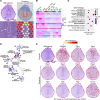
Figure 1. Spatial transcriptome revealing that lipid metabolism pathways are enriched in LE before embryo attachment.
(A) Schematic diagram of the process of embryo implantation in mice. ICM, inner cell mass; TE, trophectoderm; Tr, trophoblast; LE, luminal epithelia; Str, stroma; PDZ, primary decidual zone. (B and C) Spatial transcriptome using 10× Visium revealed LE-specific genes on day 4. In B, the area demarcated by a dashed line in the upper panels were magnified further in the lower panels. M, mesometrial pole; AM, anti-mesometrial pole; GE, glandular epithelia; Myo, myometria. Scale bars: 500 μm (upper in B) and 100 μm (lower in B). See also Supplemental Table 1. (D and E) Gene Ontology (GO) analyses using Metascape showed that LE-specific genes were enriched in lipid metabolism–related pathways. See also Supplemental Table 2. (F) Schematic diagram of PG synthesis from arachidonic acid (AA) and downstream GPCRs. (G) Spatial transcriptome of day 4 uteri showing unique expression patterns of PG synthesis–related enzymes (top) and receptors (middle and bottom). The area of LE is encircled by a dashed line. Scale bar: 500 μm. Day 4 (1000 hours) indicates 10 am on day 4 of pregnancy.
Figure 2
Figure 2. Enriched lipid-related pathways in PDZ during the embryo invasion phase.
(A and B) Spatial transcriptome using 10× Visium revealed PDZ-specific genes on day 6. In A, the area demarcated by a dashed line in the upper panels was magnified further in the lower panels. M, mesometrial pole; AM, anti-mesometrial pole; LE, luminal epithelia; GE, glandular epithelia; Str, stroma; PDZ, primary decidual zone; SDZ, secondary decidual zone; Myo, myometria. Arrowheads indicate embryos. Scale bars: 500 μm (upper in A) and 100 μm (lower in A). See also Supplemental Table 3. (C and D) Gene Ontology (GO) analyses using Metascape identified PDZ-specific genes enriched in lipid metabolism–related pathways. See also Supplemental Table 4. (E) Spatial transcriptome of day 6 implantation sites, showing unique expression patterns of PG synthetic enzymes (top) and receptors (middle and bottom). PDZ is encircled by a dashed line. Scale bar: 500 μm. Day 6 (1000 hours) indicates 10 am on day 6 of pregnancy.
Figure 3
Figure 3. Defective pregnancy phenotypes in COX2-uKO and COX1/COX2-DKO mice.
(A and B) Representative photographs of uteri on day 6 (A) and day 8 (B). In COX1/COX2-DKO uteri, unattached blastocysts were flushed from the horns. Scale bars: 5 mm (uteri) and 50 μm (blastocysts). n = 3 per genotype. Day 6 (1000 hours) and day 8 (1000 hours) indicate 10 am on each day of pregnancy. (C and D) Pregnancy rates (C) and litter sizes (D) indicating subfertility and complete infertility in COX2-uKO and DKO mice, respectively. Arrowheads indicate zero value. n.d., not detected. Data are mean ± SEM. ****P < 0.0001 by Student’s t test. The number of samples is demonstrated on each bar.
Figure 4
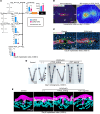
Figure 4. COX1 is crucial for PG synthesis and embryo spacing before embryo attachment.
(A) Uterine PG concentrations on day 4, as analyzed by LC-MS/MS. n = 3 for control and n = 4 for COX2-uKO and COX1/COX2-DKO mice. n.d., not detected. Day 4 (1000 hours) indicates 10 am on day 4 of pregnancy. Data are presented as mean ± SEM. *P < 0.05 by 1-way ANOVA followed by Bonferroni’s post hoc test. n.d., not detected; n.s., not significant. (B and C) 3D images of luminal and glandular epithelia around embryo implantation sites (B) and whole uterine horns (C) on day 6 of pregnancy. Embryos are indicated by asterisks (B) or arrowheads (C). Scale bars: 200 μm (B) and 1 mm (C). At least 3 independent uteri were assessed for each genotype. Day 6 (1000 hours) indicates 10 am on day 6 of pregnancy. (D) The average coefficient of variation of the lengths between each implantation site (IS) was calculated from longitudinal scanning images shown in C. n = 3 for COX2-uKO and n = 4 for control and DKO. Data are presented as mean ± SEM. **P < 0.01 by 1-way ANOVA followed by Bonferroni’s post hoc test. n.s., not significant.
Figure 5
Figure 5. COX2-dependent PG production during the embryo invasion phase.
(A) PG concentrations in day 6 implantation sites, as analyzed by LC-MS/MS. n = 3 per genotype. Data are presented as mean ± SEM. *P < 0.05 by Student’s t test. n.d., not detected; n.s., not significant. Day 6 (1000 hours) indicates 10 am on day 6 of pregnancy. (B) Immunostaining of COX2 (left) and MS imaging of PGE2/PGD2 (right) on serial sections of day 6 implantation sites. M, mesometrial pole; AM, anti-mesometrial pole; LE, luminal epithelium; GE, glandular epithelium; S, stroma. Asterisks indicate embryos. Scale bar: 200 μm. Day 6 (1000 hours) indicates 10 am on day 6 of pregnancy. Three independent sections were assessed for immunostaining and MS imaging. (C) Coimmunostaining of CK-8 (a marker of trophoblasts and epithelia) and E-cadherin (a marker of epithelia) showing defective embryo invasion in COX2-uKO mice on day 6. Asterisks indicate embryos; arrowheads indicate invading trophoblasts. Scale bar: 100 μm. Three independent sections were assessed for each genotype. Day 6 (1000 hours) indicates 10 am on day 6 of pregnancy. (D) Representative images of day 6 uteri from control and COX2-uKO mice with or without PGE2 analog/DP1 agonist administration. Arrowheads indicate faint implantation sites. Scale bar: 5 mm. n = 3 per group. Day 6 (1000 hours) indicates 10 am on day 6 of pregnancy. (E) 3D images of luminal and glandular epithelia around embryo implantation sites from control and COX2-uKO mice with or without PGE2 analog/DP1 agonist administration on day 6 of pregnancy. Asterisks indicate embryos. Scale bar: 200 μm. Three independent uteri were assessed in each group. Day 6 (1000 hours) indicates 10 am on day 6 of pregnancy.

Similar articles

Cited by

References

    1. Cha J, et al. Mechanisms of implantation: strategies for successful pregnancy. Nat Med. 2012;18(12):1754–1767. doi: 10.1038/nm.3012. - DOI - PMC - PubMed
    1. Fukui Y, et al. Uterine receptivity, embryo attachment, and embryo invasion: multistep processes in embryo implantation. Reprod Med Biol. 2019;18(3):234–240. doi: 10.1002/rmb2.12280. - DOI - PMC - PubMed
    1. Hama K, et al. Embryo spacing and implantation timing are differentially regulated by LPA3-mediated lysophosphatidic acid signaling in mice. Biol Reprod. 2007;77(6):954–959. doi: 10.1095/biolreprod.107.060293. - DOI - PubMed
    1. Sugimoto Y, et al. Roles of prostaglandin receptors in female reproduction. J Biochem. 2015;157(2):73–80. doi: 10.1093/jb/mvu081. - DOI - PubMed
    1. Dubois RN, et al. Cyclooxygenase in biology and disease. FASEB J. 1998;12(12):1063–1073. doi: 10.1096/fasebj.12.12.1063. - DOI - PubMed
  NODES
admin 2
INTERN 2
Project 1
twitter 2