[Preprint]. 2024 Sep 27:2024.09.26.615308.
doi: 10.1101/2024.09.26.615308.

Pancreatic cancer cells overexpressing interleukin 6 induce T-cell-mediated tumor clearance and durable anti-tumor immune response

Affiliations

Pancreatic cancer cells overexpressing interleukin 6 induce T-cell-mediated tumor clearance and durable anti-tumor immune response

Paige C Arneson-Wissink et al. bioRxiv. .

Abstract

Tumor immune resistance is recognized as a contributor to low survivorship in pancreatic ductal adenocarcinoma (PDAC). We developed a novel murine model of spontaneous PDAC clearance, generated by overexpressing interleukin-6 (IL-6) in orthotopically implanted PDAC cancer cells (OT-PDACIL6). Circulating IL-6 was 100-fold higher in OT-PDACIL6 than in OT-PDACparental mice. OT-PDACIL6 tumors were present at 5 days post-implantation, and undetectable by 10 days post implantation. Flow cytometry revealed increased T cells and NK cells, and decreased T regulatory cells in OT-PDACIL6 as compared to OT-PDACparental tumors. Increased lymphoid aggregates were apparent by histological assessment and may account for elevated T cell content. Antibody-based depletion of CD4+ and CD8+ T cells prevented tumor clearance and significantly reduced survival of OT-PDACIL6 mice. The anti-tumor immune response to OT-PDACIL6 rendered mice immune to re-challenge with OT-PDACparental tumors. In high concentrations, IL-6 acts in opposition to previously described pro-tumorigenic effects by enhancing the T cell-mediated anti-tumor response to PDAC.

Keywords: Interleukin 6; Pancreatic Ductal Adenocarcinoma; T-cell response.


Conflict of interest statement

Conflict of interest: RE is a paid consultant and conducts ongoing research for Lyell Immunopharma. KTB receives consultation feed from Guidepoint Global and royalties from theUniversity of Pennsylvania for licensed research cell lines. The other authors declare no conflicts.

Figures
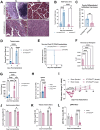
Figure 1:
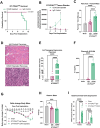
Figure 1:. Tumor-specific IL6 overexpression induces spontaneous tumor clearance and cachexia recovery.
(A) Representative pancreas cross sections at 5 (left) and 10 days (right) from OT-PDACIL6 (top) and OT-PDACparental (bottom) tumor implantation. Scale bars represent 50 um (top) and 100 um (bottom). (B) Tumor area as a percent of total tissue area at 5 and 12 days, quantified by board-certified pathologist. (C) Percentage of tumor area classified as poorly-differentiated, infiltrative carcinoma at 5 days by board-certified pathologist. (D) Tumor mass at 5 and 12 days. (B-D) N = 3 male, 3 female mice per group. (E) Survival comparison of OT-PDACParental and OT-PDACIL6. OT-PDACIL6 were euthanized for study endpoint at 24 days, but had not reached humane euthanasia criteria. N = 4 female, 6 male PDACIL6, 1 female, 4 male PDACparental mice. Statistically tested with Log-rank (Mantel-Cox) test. (F) Expression of Il6 transgene expression, measured by qPCR at 5 (N = 3 male, 3 female), 10 (N = 6 male), 17 (N = 3 male, 2 female), 24 (N = 3 male, 2 female), and 40 (N = 16 male, 16 female) days. Statistically tested with One-way ANOVA with Tukey correction for multiple comparisons. (G) Plasma IL6 measured by ELISA at 5 (N = 10 male PDACParental, 11 male PDACIL6), 12(N = 3 male, 3 female PDACParental, 3 male, 2 female PDACIL6), and 17 (N = 2 male, 3 female PDACIL6) days. Statistically tested with 2-way ANOVA main effects only with Tukey correction for multiple comparisons. (H) Spleen mass at 5 days. N = 6 male mice per group. (I) Body mass change as a percentage of initial body mass over time. N = 8 male, 8 female mice per group. Statistically tested with 3-way ANOVA. p<0.0001 for Time, Sex, Tumor Status, Time × Sex, Time × Tumor Status. p=0.0002 for Sex × Tumor Status. p= 0.2900 for Time × Sex × Tumor Status. (J) Gastrocnemius muscle mass normalized to initial body mass. (K) Tibialis anterior muscle mass normalized to initial body mass. (L) gonadal white adipose tissue (gWAT) mass normalized to initial body mass. (J-L) 5d N = 1 female, 3 male mice per group. 10d N = 6 male PDAC, 5 male sham mice. Error bars represent SEM. Unless otherwise noted, 2×2 studies were statistically tested with a full effects model 2-way ANOVA and Sidak multiple comparisons test. 2-group analysis tested with unpaired t-test. **** p<0.0001, ***p<0.001, **p<0.01, *p<0.05.
Figure 2:
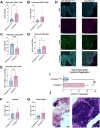
Figure 2:. OT-PDACIL6 induces lymphocytic anti-tumor immune response.
(A-E) Intratumoral immune cell populations from pancreas at 5 days: (A) CD4+ T cells, (B) CD8+ T cells, (C) Foxp3+ T regulatory cells, (D) NK1.1+ Natural Killer cells, (E) NK1.1+/CD90.2+ NK T cells. (A-C) N = 6 male mice per group. (D-E) N = 4 female, 3 male mice per group. (F-G) CD3+ cells counted per mm2 of stroma (F) or tumor nests (G) in immunofluorescence stained pancreas tissues. N = 3 male, 3 female mice per group. (H) representative images of CD3+ T cell infiltration in tumor and associated stroma of OT-PDACparental (left) and OT-PDACIL6 (right) mice. Tissues were stained with DAPI (blue), CD3 (magenta), and Pancytokeratin (PanCK, green). (scale bars = 100 um) (I) Pathologist-evaluated number of tumor-associated lymphoid aggregates in H&E stained pancreas cross sections from tissue collected at 5 days. N = 3 male, 3 female mice per group. (J) Representative H&E image of lymphoid aggregates adjacent to tumor and stroma in OT-PDACIL6 pancreas (left) and magnified image of lymphoid aggregate (right). Area of magnification is denoted on left image with orange box. Error bars represent SEM. 2-group analysis tested with unpaired t-test. **** p<0.0001, ***p<0.001, **p<0.01, *p<0.05.
Figure 3:
Figure 3:. CD4+ and CD8+ T cells are necessary for OT-PDACIL6 tumor clearance.
(A) Survival comparison of OT-PDACIL6 mice given CD4/CD8 depletion or IgG control antibodies. Statistically tested with Log-rank (Mantel-Cox) test. (B) OT-PDACIL6-LUC tumor growth, measured by IVIS imaging. Statistically tested with 2-way ANOVA, for time points with representation from both groups, with Šídák multiple testing correction. (C) Pancreas and tumor mass at endpoint. (D) Representative pancreas cross sections at humane euthanasia endpoint from IgG control (top) and CD4/CD8 depleted (bottom) mice. Scale bars represent 100 um. (E) expression of Il6 transgene expression, measured by qPCR. (F) Plasma IL6 measured by ELISA. (G) Body mass change as a percentage of initial body mass over time. Statistically tested with Mixed-effects analysis with repeated measures. p<0.0001 for Time and Time × Tumor Status. p=0.0048 for Tumor Status. (H) Gastrocnemius muscle mass at humane euthanasia endpoint normalized to initial body mass. (I) Atrophy-related gene expression (Trim63 and Fbxo32) in gastrocnemius muscle, measured by qPCR. All male mice, N = 5 sham, 10 PDACIL6 per antibody treatment group. Error bars represent SEM. 3 group studies were statistically tested with a 1-way ANOVA and Tukey correction for multiple comparisons. **** p<0.0001, ***p<0.001, **p<0.01, *p<0.05.
Figure 4:
Figure 4:. OT-PDACIL6 induces a durable T cell response to OT-PDACParental tumors.
(A) Schematic timeline for B-E. Mice were implanted with OT-PDACIL6 or given sham surgery, then all mice were rechallenged with OT-PDACParental-LUC after 76 days. (B) Survival comparison of OT-PDACIL6-recovered and sham-recovered mice. Statistically tested with Log-rank (Mantel-Cox) test. (C) OT-PDACParental-LUC tumor growth, measured by IVIS imaging. Statistically tested with mixed effects model and Šídák multiple testing correction, using imputation to match PDACIL6 endpoint with the sham endpoint. (D) Tumor mass at humane euthanasia endpoint for sham-recovered OT-PDACParental-LUC tumors. (E) Body mass change as a percentage of initial body mass over time. Statistically tested with mixed effects model and Šídák multiple testing correction at timepoints where both groups were represented. p=0.0435 for Time, p=0.4903 for Tumor Status, p=0.0002 for Time × Tumor Status. (A-E) N = 7 male PDACIL6, 8 male sham, 7 female PDACIL6, 6 female sham. (F) Schematic timeline for G-I. Mice were implanted with OT-PDACIL6 or given Sham surgery. 28 days later, mice were rechallenged with OT-PDACParental, and given CD4/CD8 depletion or IgG control antibodies beginning on D26 and every 4 days thereafter (denoted with double green lines). (G) Pancreas/tumor mass at 12 days. (H) Intratumoral CD4+ T cells at 12 days. (I) Intra-tumoral CD8+ T cells at 12 days. (F-I) All male mice N = 6 per group. Error bars represent SEM. 2×2 studies were statistically tested with a full effects model 2-way ANOVA and Sidak multiple comparisons test. **** p<0.0001, ***p<0.001, **p<0.01, *p<0.05.

Similar articles

References

    1. Corcoran R. B. et al. STAT3 plays a critical role in KRAS-induced pancreatic tumorigenesis. Cancer research 71, 5020–5029 (2011). - PMC - PubMed
    1. Suh S.-Y. et al. Interleukin-6 but not tumour necrosis factor-alpha predicts survival in patients with advanced cancer. Supportive Care in Cancer 21, 3071–3077 (2013). - PubMed
    1. Rupert J. E. et al. Tumor-derived IL-6 and trans-signaling among tumor, fat, and muscle mediate pancreatic cancer cachexia. Journal of Experimental Medicine 218, e20190450 (2021). - PMC - PubMed
    1. Razidlo G. L., Burton K. M. & McNiven M. A. Interleukin-6 promotes pancreatic cancer cell migration by rapidly activating the small GTPase CDC42. Journal of Biological Chemistry 293, 11143–11153 (2018). - PMC - PubMed
    1. Flint T. R. et al. Tumor-induced IL-6 reprograms host metabolism to suppress anti-tumor immunity. Cell metabolism 24, 672–684 (2016). - PMC - PubMed

Publication types

  NODES
Note 3
twitter 2