In Silico Insights Reveal Fibronectin 1 as a Theranostic Marker in Gastric Cancer
- PMID: 39456895
- PMCID: PMC11507984
- DOI: 10.3390/ijms252011113
In Silico Insights Reveal Fibronectin 1 as a Theranostic Marker in Gastric Cancer
Abstract
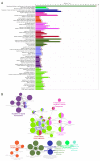
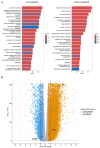
Gastric cancer (GC) is a complex and highly variable disease, ranking among the top five cancers diagnosed globally, and a leading cause of cancer-related deaths. Emerging from stomach lining cells amid chronic inflammation, it often advances to preneoplastic stages. Late-stage diagnoses and treatment challenges highlight the critical need for early detection and innovative biomarkers, motivating this study's focus on identifying theranostic markers through gene ontology analysis. By exploring deregulated biological processes, this study aims to uncover insights into cancer progression and associated markers, potentially identifying novel theranostic candidates in GC. Using public data from The Human Protein Atlas, this study pinpointed 299 prognostic genes, delineating 171 with unfavorable prognosis and 128 with favorable prognosis. Functional enrichment and protein-protein interaction analyses, supported by RNAseq results and conducted via Metascape and Cytoscape, highlighted five genes (vWF, FN1, THBS1, PCDH7, and F5) with promising theranostic potential. Notably, FN1 and THBS1 exhibited significant promise, with FN1 showing a 370% expression increase in cancerous tissue, and it is possible that FN1 can also indicate the stratification status in GC. While further validation is essential, these findings provide new insights into molecular alterations in GC and potential avenues for clinical application of theranostic markers.
Keywords: FN1 gene; gastric cancer; gene ontology; theranostic markers.
Conflict of interest statement
The authors declare no conflicts of interest.
Figures


Similar articles
-
FN1, SPARC, and SERPINE1 are highly expressed and significantly related to a poor prognosis of gastric adenocarcinoma revealed by microarray and bioinformatics.Sci Rep. 2019 May 24;9(1):7827. doi: 10.1038/s41598-019-43924-x. Sci Rep. 2019. PMID: 31127138 Free PMC article.
-
Weighted correlation network analysis identifies FN1, COL1A1 and SERPINE1 associated with the progression and prognosis of gastric cancer.Cancer Biomark. 2021;31(1):59-75. doi: 10.3233/CBM-200594. Cancer Biomark. 2021. PMID: 33780362
-
Identification and validation of key genes in gastric cancer: insights from in silico analysis, clinical samples, and functional assays.Aging (Albany NY). 2024 Jun 23;16(12):10615-10635. doi: 10.18632/aging.205965. Epub 2024 Jun 23. Aging (Albany NY). 2024. PMID: 38913913 Free PMC article.
-
Pathogenetic mechanisms in gastric cancer.World J Gastroenterol. 2014 Oct 14;20(38):13804-19. doi: 10.3748/wjg.v20.i38.13804. World J Gastroenterol. 2014. PMID: 25320518 Free PMC article. Review.
-
MicroRNAs as promising biomarkers for gastric cancer.Cancer Biomark. 2012;11(6):259-67. doi: 10.3233/CBM-2012-00284. Cancer Biomark. 2012. PMID: 23248184 Review.
References
-
- Ministerio de Salud . Guía de Práctica Clínica Cáncer Gástrico. Ministerio de Salud; Santiago, Chile: 2020. [(accessed on 1 September 2024)]. pp. 1–21. Available online: https://diprece.minsal.cl/wp-content/uploads/2021/05/RE_GPC-Ca%CC%81ncer....
-
- Bornschein J., Quante M., Fassan M. Gastric Cancer; Epidemiology and Diagnosis. In: Kuipers E.J., editor. Encyclopedia of Gastroenterology. 2nd ed. Academic Press; Oxford, UK: 2020. pp. 553–564. - DOI
MeSH terms
Substances
Grants and funding
- 1210440/Fondo Nacional de Desarrollo Científico y Tecnológico
- ID21I10027/Fondo de Fomento al Desarrollo Científico y Tecnológico FONDEF
- ICN09_016/ICN 2021_045; former P09/016-F/Instituto Milenio en Inmunología e Inmunoterapia
- scholarship 242230375/Agencia Nacional de Investigación y Desarrollo
- DI24-49/DIUFRO
LinkOut - more resources
Full Text Sources
Medical
Miscellaneous

