. 2024 Sep 30;12(10):2225.
doi: 10.3390/biomedicines12102225.

Comprehensive Analysis of a Platelet- and Coagulation-Related Prognostic Gene Signature Identifies CYP19A1 as a Key Tumorigenic Driver of Colorectal Cancer

Affiliations

Comprehensive Analysis of a Platelet- and Coagulation-Related Prognostic Gene Signature Identifies CYP19A1 as a Key Tumorigenic Driver of Colorectal Cancer

Guoqing Su et al. Biomedicines. .

Abstract

Background: The intricate interplay between the platelet-coagulation system and the progression of malignant tumors has profound therapeutic implications. However, a thorough examination of platelet and coagulation markers specific to colorectal cancer (CRC) is conspicuously absent in the current literature. Consequently, there is an urgent need for further exploration into the mechanistic underpinnings of these markers and their potential clinical applications.

Methods: By integrating RNA-seq data and clinicopathological information from patients with CRC in the cancer genome atlas, we identified genes related to the platelet-coagulation system using weighted gene co-expression networks and univariate Cox analysis. We established a prognostic risk model based on platelet- and coagulation-related genes using Lasso Cox regression analysis and validated the model in two independent CRC cohorts. We explored potential biological functional disparities between high-risk and low-risk groups through comprehensive bioinformatics analysis.

Results: Our findings indicate that colorectal cancer patients classified as high-risk generally exhibit poorer prognoses. Moreover, the model's risk scores were associated with the differential composition of the immune tumor microenvironment, suggesting its applicability to infer immunotherapy responsiveness. Cellular functional experiments and animal experiments indicated that CYP19A1 expression in CRC influences malignant phenotype and platelet activation.

Conclusions: In summary, we present a novel platelet- and coagulation-related risk model for prognostic assessment of patients with CRC and confirm the important role of CYP19A1 in promoting malignant progression of CRC.

Keywords: CYP19A1; coagulation; colorectal cancer; platelet; prognosis; single-cell sequencing; survival; weighted gene co-expression network analysis.


Conflict of interest statement

The authors have no conflicts of interest.

Figures
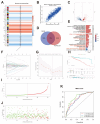
Figure 1
Figure 1
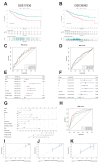
Construction of a platelet-coagulation-related prognostic model for CRC. (A) Heatmap of module–trait relationships. The blue module was considerably associated with the HALLMARK_COAGULATION gene set. (B) Scatter plot showing the correlation between gene module membership in the blue module and gene significance. (C) Differential analysis of blue module genes. (D) Venn diagram illustrating the overlap between differentially expressed genes (DEGs) in the blue module and the platelet-related gene set. (E) GO analysis of 376 platelet-coagulation-related genes (PCRGs) (The pathways labeled in red font are GO terms associated with platelet function). (F) Coefficient values of PCRGs. (G) Partial likelihood deviance of PCRGs. (H) Risk score and survival probabilities in the TCGA training set. (I,J) Distribution of risk scores and survival status in the TCGA-COAD cohort. (K) ROC curves for TCGA-COAD cases at 1, 3, and 5 years.
Figure 2
Figure 2
Validation of the prognostic model and development of a survival prediction nomogram. (A,B) Overall survival (OS) curves for patients in various risk groups based on the models, shown for the GSE17536 (left) and GSE39582 (right) cohorts. (C,D) ROC curves for predicting CRC patient outcomes at 1, 3, and 5 years in the GSE17536 (left) and GSE39582 (right) cohorts. (E,F) COX regression analysis for assessing the independent prognostic value of risk scores in the TCGA-COAD cohort. (E) Univariate regression analysis. (F) Multivariate regression analysis. (G) A nomogram integrating the risk score derived from PCRGs with clinicopathological factors was created to estimate 1-, 3-, and 5-year survival. (H) ROC curves were used to assess the nomogram’s prognostic accuracy. (IK) Calibration curves showing the predictions of the nomogram for 1- (I), 3- (J), and 5-year (K) OS.
Figure 3
Figure 3
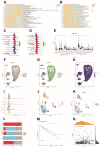
Functional enrichment analysis and scRNA-seq findings based on the CRC risk score. (A) GSVA-based GO enrichment analysis between risk groups. (B) GSVA-based KEGG enrichment analysis between risk groups. (C) Ridgeline plots depicting KEGG pathways enriched in each risk group according to GSEA. (D) Ridgeline plots depicting GO pathways enriched in each risk group according to GSEA. (E) Boxplots of differences in infiltrating immune cells between the risk groups. (F,G) UMAP plots of 21796 cells colored by sample or cell type. (H) Scatter plots showing the distribution of risk score expression in different cell clusters. (I) Ridgeline plots indicating the distribution of risk scores for different cell types. (J) UMAP plot depicting clustering of CRC-associated fibroblasts into 5 subtypes. (K) Metastasis-associated fibroblasts were identified using the Scissor package; Scissor+ cells (M1-stage-associated) are shown in red, and Scissor- cells (M0-stage-associated) in blue. (L) Comparative proportions of Scissor+ and Scissor- cells across different fibroblast subpopulations. (M) Survival analysis in the TCGA-COAD cohort, based on the C5 fibroblast subtype score. (N) Dot plot of the correlation between C5 fibroblast subtype score and model risk score in the TCGA-COAD cohort. * p < 0.05; ** p < 0.01; *** p < 0.001.
Figure 4
Figure 4
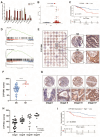
CYP19A1 upregulation correlates with poor prognosis in CRC. (A) Differential expression of 10 PCRGs in CRC HT29 cells and in normal colorectal CCC-HIE-2 cells. (B) Differential expression of the CYP19A1 gene between CRC and normal colorectal tissues in the TCGA-COAD cohort. (C) Kaplan–Meier (KM) curve for OS of patients in the TCGA-COAD dataset. Patients were stratified into low and high expression groups based on median CYP19A1 expression. (D) GSEA plots showing enrichment of genes related to cell growth and cell–cell adhesion in patients with high vs. low CYP19A1 expression in the TCGA-COAD dataset. (E,F) Immunohistochemical validation of CYP19A1 expression levels in M1 stage vs. M0 stage tumor tissues. Scale bar = 50 μm. (G,H) Immunohistochemical analysis of CYP19A1 expression across different pathological stages. Scale bar = 50 μm. (I) Prognostic analysis of CYP19A1 in 96 CRC patient samples in a tissue microarray. ** p < 0.01; *** p < 0.001; **** p < 0.0001. The black line represents the median value.
Figure 5
Figure 5
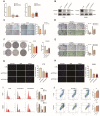
CYP19A1 silencing inhibits CRC cell migration, invasion, and proliferation. (A,B) Analysis of CYP19A1 mRNA (A) and protein (B) expression levels in HT29 and SW480 cells following transfection with two different CYP19A1 siRNA sequences, with si-NC serving as the negative control. (C) Representative images and quantification from wound-healing assays evaluating the impact of CYP19A1 silencing on CRC cell migration. (D,E) Representative images and quantification from Transwell assays assessing the effects of CYP19A1 silencing on the migration and invasion capabilities of CRC cells. (F) Representative images and quantification from colony formation assays to examine the influence of CYP19A1 silencing on the tumorigenic potential of HT29 and SW480 cells. (G,H) Representative images and quantification from EdU incorporation assays measuring proliferation in HT29 (G) and SW480 (H) cells. (I) Flow cytometric analysis of the cell cycle on the 7th day post-transfection with si-CYP19A1. (J) Flow cytometric analysis of apoptosis in CRC cells using Annexin V-FITC staining. * p < 0.05; ** p < 0.01; *** p < 0.001; **** p < 0.0001.
Figure 6
Figure 6
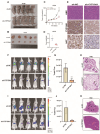
CYP19A1 silencing inhibits proliferative and metastatic behavior of CRC cells in vivo. Xenografts were established in nude mice by inoculating HT29 cells transfected with either sh-NC or sh-CYP19A1. (A,B) Representative photographs of HT29 cell xenografts in situ (A) and excised tumors (B). (C) Tumor volume growth curve. Data are shown as mean ± SEM of five mice in each group (two-way ANOVA). (D) Excised tumor weight (Mann–Whitney test). (E) Representative H&E staining and CYP19A1 and Ki-67 immunohistochemistry images from HT29 cell xenografts. Statistical analyses were carried out using Student’s t-test. (F,G) Bioluminescence images of mice intravenously injected with HT29 cells transfected with either sh-NC or sh-CYP19A1 and corresponding quantification of bioluminescence intensities (n = 5). (H) Representative H&E staining images of lung tissues showing metastatic lung foci (arrows) in mice intravenously injected with HT29 cells. (I,J) Bioluminescence imaging of mouse livers and corresponding quantification of bioluminescence intensity (n = 5). (K) Representative H&E-stained images of mouse liver tissue displaying metastatic liver lesions (arrow). ** p < 0.01; *** p < 0.001; **** p < 0.0001.
Figure 7
Figure 7
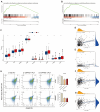
CYP19A1 expression in CRC cells promotes platelet activation. (A,B) GSEA plots illustrating the enrichment of genes associated with “homophilic cell adhesion via plasma membrane adhesion molecules” and “cell–cell adhesion via plasma membrane adhesion molecules” in patients with high versus low CYP19A1 expression within the TCGA COAD dataset. (C) Boxplots depicting differences in the expression of platelet activation-related genes among high and low CYP19A1 expression groups. (DG) Scatter plots showing the correlation between CYP19A1 and SELP, TF, PODXL, and PDPN genes. (H) Flow cytometry analysis of platelets co-cultured with CRC cells. HT29 and SW480 cells were transfected with si-NC, si-CYP19A1, or si-CYP19A2 and then co-cultured with platelets (PLT). Platelet activation was quantified based on CD62P and PAC-1 surface expression. ns p > 0.05; ** p < 0.01; *** p < 0.001; **** p < 0.0001.

Similar articles

References

    1. Jemal A., Bray F., Center M.M., Ferlay J., Ward E., Forman D. Global cancer statistics. CA Cancer J. Clin. 2011;61:69–90. doi: 10.3322/caac.20107. - DOI - PubMed
    1. Bray F., Ferlay J., Soerjomataram I., Siegel R.L., Torre L.A., Jemal A. Global cancer statistics 2018: GLOBOCAN estimates of incidence and mortality worldwide for 36 cancers in 185 countries. CA Cancer J. Clin. 2018;68:394–424. doi: 10.3322/caac.21492. - DOI - PubMed
    1. Siegel R.L., Wagle N.S., Cercek A., Smith R.A., Jemal A. Colorectal cancer statistics, 2023. CA Cancer J. Clin. 2023;73:233–254. doi: 10.3322/caac.21772. - DOI - PubMed
    1. Gaedcke J., Grade M., Camps J., Søkilde R., Kaczkowski B., Schetter A.J., Difilippantonio M.J., Harris C.C., Ghadimi B.M., Møller S., et al. The rectal cancer microRNAome—microRNA expression in rectal cancer and matched normal mucosa. Clin. Cancer Res. 2012;18:4919–4930. doi: 10.1158/1078-0432.CCR-12-0016. - DOI - PMC - PubMed
    1. Siegel R.L., Miller K.D., Jemal A. Cancer statistics, 2019. CA Cancer J. Clin. 2019;69:7–34. doi: 10.3322/caac.21551. - DOI - PubMed

LinkOut - more resources

  NODES
innovation 1
Project 3
twitter 2