. 2024 Oct 10;16(10):1314.
doi: 10.3390/pharmaceutics16101314.

A Human Brain-Chip for Modeling Brain Pathologies and Screening Blood-Brain Barrier Crossing Therapeutic Strategies

Affiliations

A Human Brain-Chip for Modeling Brain Pathologies and Screening Blood-Brain Barrier Crossing Therapeutic Strategies

Shek Man Chim et al. Pharmaceutics. .

Abstract

Background/Objectives: The limited translatability of preclinical experimental findings to patients remains an obstacle for successful treatment of brain diseases. Relevant models to elucidate mechanisms behind brain pathogenesis, including cell-specific contributions and cell-cell interactions, and support successful _targeting and prediction of drug responses in humans are urgently needed, given the species differences in brain and blood-brain barrier (BBB) functions. Human microphysiological systems (MPS), such as Organ-Chips, are emerging as a promising approach to address these challenges. Here, we examined and advanced a Brain-Chip that recapitulates aspects of the human cortical parenchyma and the BBB in one model. Methods: We utilized human primary astrocytes and pericytes, human induced pluripotent stem cell (hiPSC)-derived cortical neurons, and hiPSC-derived brain microvascular endothelial-like cells and included for the first time on-chip hiPSC-derived microglia. Results: Using Tumor necrosis factor alpha (TNFα) to emulate neuroinflammation, we demonstrate that our model recapitulates in vivo-relevant responses. Importantly, we show microglia-derived responses, highlighting the Brain-Chip's sensitivity to capture cell-specific contributions in human disease-associated pathology. We then tested BBB crossing of human transferrin receptor antibodies and conjugated adeno-associated viruses. We demonstrate successful in vitro/in vivo correlation in identifying crossing differences, underscoring the model's capacity as a screening platform for BBB crossing therapeutic strategies and ability to predict in vivo responses. Conclusions: These findings highlight the potential of the Brain-Chip as a reliable and time-efficient model to support therapeutic development and provide mechanistic insights into brain diseases, adding to the growing evidence supporting the value of MPS in translational research and drug discovery.

Keywords: cell-specific contributions; microfluidics brain-chip; physiologically relevant responses; screening of BBB-crossing therapeutics.


Conflict of interest statement

S.M.C., K.H. and B.Z. are full-time employees of Regeneron Pharmaceuticals Inc. and receive stock options/restricted stock as part of their compensation. K.K. and E.P. were full-time employees of Regeneron Pharmaceuticals Inc. and received stock options/restricted stock as part of their compensation during their employment.

Figures
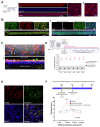
Figure 1
Figure 1
Characterization of the human cortical Brain-Chip. (A) Representative confocal images showing the hiPSC-derived microvascular endothelial-like cells (iBMECs) attached to the porous membrane (vascular channel). (i) Immunostaining against the tight junction marker ZO-1. Stack of Z-series for the vascular channel (left) and high magnification optical section of ZO-1 staining (right) are shown. (ii) Immunostaining against the brain microvascular endothelial cell marker GLUT1 (stack of Z-series). (B) Confocal images of astrocytes (GFAP) with pericytes (NG2) (i) and neurons (MAP2) with microglia (Iba1 and CD68) (ii) attached to the porous membrane in the brain channel. Confocal images (stack of Z-series) of the entire brain channel (top) and high-magnification confocal optical sections (bottom). All cell types were present and uniformly distributed along the entire brain channel. (C) (i): Confocal micrograph (stack of z-series) showing immunofluorescence staining against GFAP (astrocytes) and MAP2 (neurons) coupled with phase contrast for visualization of the porous membrane. (ii): Digital 3D reconstruction of z-series image stacks showing the Brain-Chip from the side. The interrupted line indicates the location of the porous membrane separating the brain from the vascular channel. The nuclear staining (Hoechst) on the vascular side indicates the iBMECs. A GFAP signal is detected in the vascular side (arrows). Arrows in both images indicate the astrocytic end-feet passing through the 7 μm pores extending into the vascular channel. (D) Schematic representation of the experimental design and averaged data from quantitative barrier function analysis via apparent permeability (Papp) to 3 kDa fluorescent dextran crossing through the vascular channel to the brain channel on Days 1 through 6 in microfluidics. Chips with and without iBMECs were examined (N = 6 chips/group). Each data point represents an individual chip. Graph: mean ± SEM. Shaded box: range of Papp values shown in animal models. (E) Confocal images showing GABAergic (VGAT) and glutamatergic neurons (VGLUT1) in the brain channel of the chip. All stainings were performed in Brain-Chips after six days in microfluidics. (F) Examination of functional connectivity between GABAergic and glutamatergic neurons using pharmacology and extracellular glutamate measurements. The experimental design (top) and extracellular glutamate quantification (mean ± SEM) for the indicated time points and treatments are shown. N = 3 chips/group, *** p < 0.001, two-way ANOVA and post hoc Tukey’s test.
Figure 2
Figure 2
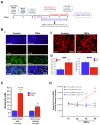
TNFα-induced neuroinflammation and BBB disruption in the Brain-Chip. (A) Outline of the experimental design. Beginning on Day 2 in microfluidics, 100 ng/mL of TNFα were dosed in the brain channel and replenished 24 h later. Chips dosed with PBS were used as the control. Immunocytochemistry and extracellular glutamate measurements were performed on Day 4. Effluents were collected daily from Day 1 to Day 4 for the BBB permeability assay (Days 1–4) and cytokines/chemokines analysis (Days 2–4). (B) Representative confocal images of microglia (CD68) and neurons (MAP2) (i) and astrocytes (ii). (iii) Averaged data (mean ± SEM) for the number of CD68+ cells and MAP2 intensity. TNFα treatment increases the numbers of CD68-positive cells, indicative of microglial reactivity. The signal intensity of the neuronal dendritic marker MAP2 is decreased, suggesting neuronal dysfunction. High-resolution stacks of z-series from brain channel areas (50% coverage of the channel) were analyzed for each chip. N = 3 chips/treatment. Confocal images of all chips used for MAP and CD68 analysis can be found in Figure S2. The morphology of reactive astrocytes upon TNFα exposure changes from a polygonal state to a more elongated state (see Figure S3 for additional chips and images). (C) Averaged data (mean ± SEM) of extracellular glutamate measurements in brain effluents collected at the end of the experiment (day 4). N = 3 chips/group. Red asterisks: comparison with TNFα-treated chips without microglia. Black asterisks: comparison with the respective control. (D) Apparent permeability (Papp) of the barrier across days (mean ± SEM). Papp on Day 2 was measured immediately before TNFα perfusion. Chips with microglia, N = 4; chips without microglia, N = 3. (BD) * p < 0.05, ** p< 0.01, *** p < 0.001, **** p < 0.0001, Student’s t-test (B) and one-way (C) or two-way (D) ANOVA with post hoc Tukey’s test (significantly different compared with all other groups).
Figure 3
Figure 3
TNFα-induced secretion of cytokines and chemokines and contribution of microglia. Longitudinal analysis of cytokines and chemokines in brain channel effluents collected at the indicated time points. Effluent collection on Day 2 was performed immediately prior to TNFα dosing (baseline levels of cytokines and chemokines). Brain-Chips with and without microglia were examined to determine their contribution to the observed inflammatory responses. All other cell types (astrocytes, pericytes, glutamatergic and GABAergic neurons, brain microvascular endothelial-like cells) were present in the chips. Brain-Chips (with and without microglia) treated with PBS were used as controls. Graphs: averaged data (mean ± SEM) from 4 chips for each group. Microglial-specific responses are indicated by the blue rectangles.
Figure 4
Figure 4
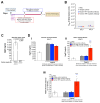
Specificity of the Brain-Chip for human transferrin receptor-mediated BBB crossing. (A) Schematic representation of experimental design. On Day 1 in microfluidics, the vascular channel was perfused with a human antibody specific for human TfR1 or mouse TfR1, or isotype control antibody (human IgG1), at a final concentration ~10 μg/mL. PBS was used as a baseline control. On Day 2, effluents from the brain channel were collected for hIgG1 measurements. The permeability of the barrier was examined on Days 1 and 2 by measuring its Papp to a 3 kDa fluorescent dextran perfused to the vascular channel starting at the beginning of incubation in microfluidics. (B) All chips had a tight barrier with similar Papp values, which were within the range of those shown in published works and in rodent models (shaded box). Each data point represents an individual chip. (C) Measurement of hIgG1 levels in culture media of vascular and brain channels prior to perfusion of the TfR1 antibodies (N = 3 and N = 5 chips, respectively, for vascular and brain channel). hIgG1 was detected in the vascular maintenance medium, as it contained 2% human serum. Data points represent three individual measurements. (D) Quantification of hIgG1 in the vascular channel media prior to perfusion (influent) (i) and in brain channel effluents collected 24 h post-dosing (ii). The percentage of vascular hIgG1 detected in the brain channel for each treatment group was also calculated (iii). Averaged data (mean ± SEM) and individual chip values are shown in (iiii). N = 3 chips per group. ** p < 0.01, *** p < 0.001, one-way ANOVA with post hoc Tukey’s test. Blue asterisks: comparison with mouse TfR1. Black asterisks: comparison with hIgG1.
Figure 5
Figure 5
The human Brain-Chip has the resolution to identify BBB crossing differences between human TfR1 antibodies. (A) Outline of the experimental design. The chips were connected to microfluidics for one day prior to antibody administration of human TfR1 antibodies with varying BBB crossing properties in vivo. The vascular channel was dosed with the antibodies in serum-free culture media at 10 μg/mL. PBS and an isotype antibody were used as negative controls. After 8 h, effluents from the brain channel were collected for antibody measurements. (B) Antibody quantification data. Mean ± SEM and individual chip values are shown. Antibody quantification in vascular channel media prior to perfusion (left) and in the brain channel effluent 8 h post-dosing (middle) are shown. The right graph shows the percentage of the dosed antibodies detected in the brain channel. Four human TfR1 antibody clones with different BBB crossing ability were examined (REGN1, REGN5, REGN12, and REGN28). The clones were tested in mice as conjugates to AAV9 expressing GFP, and their BBB crossing ability was determined based on immunohistochemical detection and quantification of the GFP signal in the brain parenchyma. The numeric immunohistochemical scores and their order based on their BBB crossing abilities are shown below the graphs. N = 6 chips/group. * p < 0.05, ** p < 0.01, *** p < 0.001, **** p < 0.0001, one-way ANOVA with post hoc Tukey’s test. Black asterisks: comparison with isotype antibody control. Light blue asterisks: comparison between groups, as indicated. No differences in BBB permeability were observed between groups (Figure S5A).
Figure 6
Figure 6
The human Brain-Chip detects different levels of permeation hTfR1 antibody-conjugated AAV9. (A) Schematic of the experimental design. AAV9 expressing GFP and decorated with hTfR1 antibodies were perfused in the vascular channel for two days (Days 1–3). On Day 5, the endothelial-like cells from the vascular channel and the brain channel cells were collected for GFP protein analysis. (B) Graphs showing averaged data (mean ± SEM) and individual chip values of GFP protein quantification analysis in endothelial and brain cell lysates, as indicated. The hTfR1 antibody-conjugated viruses were tested in vivo for their BBB crossing abilities, based on GFP signal intensity scoring in the mouse brain parenchyma, as shown below the graphs. We examined AAV9 conjugated with the same hTfR1 clones tested as purified antibodies in the chip (REGN1, REGN5, REGN12, REGN28) plus viruses conjugated with the antibody clone REGN25, which exhibited low BBB crossing in vivo. Unconjugated AAV9 and hASGR1-conjugated viruses were used as negative controls. hTfR1 antibody-conjugated AAV9: N = 6 chips for each group; PBS, AAV9 and hASGR1-AAV9: N = 3; * p < 0.05, ** p < 0.01, *** p < 0.001, **** p < 0.0001, one-way ANOVA with post hoc Tukey’s test. Black asterisks: comparison with PBS, AAV9, and hASGR1-AAV9. Red asterisks: comparison with REGN1. Blue asterisks: comparison with REGN5. Light blue asterisks: comparison with REGN12. All chips had a tight barrier with comparable Papp (Figure S5A). The amount of total protein in endothelial and brain channel cell lysates was comparable between groups (Figure S5B).

Similar articles

References

    1. Dementia A. 2021 Alzheimer’s disease facts and figures. Alzheimer’s Dement. 2021;17:327–406. doi: 10.1002/alz.12328. - DOI - PubMed
    1. Cai Y., Fan K., Lin J., Ma L., Li F. Advances in BBB on Chip and Application for Studying Reversible Opening of Blood-Brain Barrier by Sonoporation. Micromachines. 2022;14:112. doi: 10.3390/mi14010112. - DOI - PMC - PubMed
    1. Gribkoff V.K., Kaczmarek L.K. The need for new approaches in CNS drug discovery: Why drugs have failed, and what can be done to improve outcomes. Neuropharmacology. 2017;120:11–19. doi: 10.1016/j.neuropharm.2016.03.021. - DOI - PMC - PubMed
    1. Atkins J.T., George G.C., Hess K., Marcelo-Lewis K.L., Yuan Y., Borthakur G., Khozin S., LoRusso P., Hong D.S. Pre-clinical animal models are poor predictors of human toxicities in phase 1 oncology clinical trials. Br. J. Cancer. 2020;123:1496–1501. doi: 10.1038/s41416-020-01033-x. - DOI - PMC - PubMed
    1. Van Norman G.A. Limitations of Animal Studies for Predicting Toxicity in Clinical Trials: Is it Time to Rethink Our Current Approach? JACC Basic Transl. Sci. 2019;4:845–854. doi: 10.1016/j.jacbts.2019.10.008. - DOI - PMC - PubMed

Grants and funding

This research was funded by Regeneron Pharmaceuticals, Inc.

LinkOut - more resources

  NODES
admin 1
twitter 2