High level of aneuploidy and recurrent loss of chromosome 11 as relevant features of somatotroph pituitary tumors
- PMID: 39497133
- PMCID: PMC11536836
- DOI: 10.1186/s12967-024-05736-0
High level of aneuploidy and recurrent loss of chromosome 11 as relevant features of somatotroph pituitary tumors
Abstract
Background: Somatotroph neuroendocrine pituitary tumors (sPitNET) are a subtype of pituitary tumors that commonly cause acromegaly. Our study aimed to determine the spectrum of DNA copy number abnormalities (CNAs) in sPitNETs and their relevance.
Methods: A landscape of CNAs in sPitNETs was determined using combined whole-genome approaches involving low-pass whole genome sequencing and SNP microarrays. Fluorescent in situ hybridization (FISH) was used for microscopic validation of CNAs. The tumors were also subjected to transcriptome and DNA methylation analyses with RNAseq and microarrays, respectively.
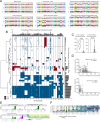
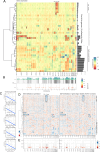
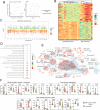
Results: We observed a wide spectrum of cytogenetic changes ranging from multiple deletions, recurrent chromosome 11 loss, stable genomes, to duplication of the majority of the chromosomes. The identified CNAs were confirmed with FISH. sPitNETs with multiple duplications were characterized by intratumoral heterogeneity in chromosome number variation in individual tumor cells, as determined with FISH. These tumors were separate CNA-related sPitNET subtype in clustering analyses with CNA signature specific for whole genome doubling-related etiology. This subtype encompassed GNAS-wild type, mostly densely granulated tumors with favorable expression level of known prognosis-related genes, notably enriched with POUF1/NR5A1-double positive PitNETs. Chromosomal deletions in sPitNETs are functionally relevant. They occurred in gene-dense DNA regions and were related to genes downregulation and increased DNA methylation in the CpG island and promoter regions in the affected regions. Recurrent loss of chromosome 11 was reflected by lowered MEN1 and AIP. No such unequivocal relevance was found for chromosomal gains. Comparisons of transcriptomes of selected most cytogenetically stable sPitNETs with tumors with recurrent loss of chromosome 11 showed upregulation of processes related to gene dosage compensation mechanism in tumors with deletion. Comparison of stable tumors with those with multiple duplications showed upregulation of processes related to mitotic spindle, DNA repair, and chromatin organization. Both comparisons showed upregulation of the processes related to immune infiltration in cytogenetically stable tumors and deconvolution of DNA methylation data indicated a higher content of specified immune cells and lower tumor purity in these tumors.
Conclusions: sPitNETs fall into three relevant cytogenetic groups: highly aneuploid tumors characterized by known prognostically favorable features and low aneuploidy tumors including specific subtype with chromosome 11 loss.
Keywords: Acromegaly; Cytogenetic abnormalities; DNA copy number variations; Gene expression regulation, neoplastic; Growth hormone-secreting pituitary adenoma; Pituitary tumors.
© 2024. The Author(s).
Conflict of interest statement
The authors declare that they have no competing interests.
Figures


Similar articles
-
DNA Methylation Pattern in Somatotroph Pituitary Neuroendocrine Tumors.Neuroendocrinology. 2024;114(1):51-63. doi: 10.1159/000533692. Epub 2023 Sep 12. Neuroendocrinology. 2024. PMID: 37699356
-
Genetic and Epigenetic Characterization of Growth Hormone-Secreting Pituitary Tumors.Mol Cancer Res. 2019 Dec;17(12):2432-2443. doi: 10.1158/1541-7786.MCR-19-0434. Epub 2019 Oct 2. Mol Cancer Res. 2019. PMID: 31578227
-
Genomic Alterations and Complex Subclonal Architecture in Sporadic GH-Secreting Pituitary Adenomas.J Clin Endocrinol Metab. 2018 May 1;103(5):1929-1939. doi: 10.1210/jc.2017-02287. J Clin Endocrinol Metab. 2018. PMID: 29474559
-
The Epigenomic Landscape of Pituitary Adenomas Reveals Specific Alterations and Differentiates Among Acromegaly, Cushing's Disease and Endocrine-Inactive Subtypes.Clin Cancer Res. 2018 Sep 1;24(17):4126-4136. doi: 10.1158/1078-0432.CCR-17-2206. Epub 2018 Jul 3. Clin Cancer Res. 2018. PMID: 30084836
-
Molecular cytogenetics of chromosome 11 in pituitary adenomas: a comparison of fluorescence in situ hybridization and DNA ploidy study.Hum Pathol. 1999 Nov;30(11):1377-82. doi: 10.1016/s0046-8177(99)90072-2. Hum Pathol. 1999. PMID: 10571521
References
-
- Asa SL, Kucharczyk W, Ezzat S. Pituitary acromegaly: not one disease. Endocr Relat Cancer. 2017;24:C1–4. - PubMed
-
- Swanson AA, Erickson D, Donegan DM, Jenkins SM, van Gompel JJ, Atkinson JLD, et al. Clinical, biological, radiological, and pathological comparison of sparsely and densely granulated somatotroph adenomas: a single center experience from a cohort of 131 patients with acromegaly. Pituitary. 2021;24:192–206. - PubMed
-
- Asa SL, Mete O, Perry A, Osamura RY. Overview of the 2022 WHO classification of Pituitary tumors. Endocr Pathol. Springer; 2022. pp. 6–26. - PubMed
MeSH terms
Grants and funding
LinkOut - more resources
Full Text Sources
Miscellaneous

