Floods of Egypt's Nile in the 21st century
- PMID: 39505946
- PMCID: PMC11541909
- DOI: 10.1038/s41598-024-77002-8
Floods of Egypt's Nile in the 21st century
Abstract
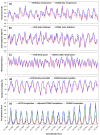
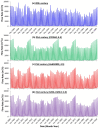
Extreme precipitation and flooding events are rising globally, necessitating a thorough understanding and sustainable management of water resources. One such setting is the Nile River's source areas, where high precipitation has led to the filling of Lake Nasser (LN) twice (1998-2003; 2019-2022) in the last two decades and the diversion of overflow to depressions west of the Nile, where it is lost mainly to evaporation. Using temporal satellite-based data, climate models, and continuous rainfall-runoff models, we identified the primary contributor to increased runoff that reached LN in the past two decades and assessed the impact of climate change on the LN's runoff throughout the twenty-first century. Findings include: (1) the Blue Nile subbasin (BNS) is the primary contributor to increased downstream runoff, (2) the BNS runoff was simulated in the twenty-first century using a calibrated (1965-1992) rainfall-runoff model with global circulation models (GCMs), CCSM4, HadGEM3, and GFDL-CM4.0, projections as model inputs, (3) the extreme value analysis for projected runoff driven by GCMs' output indicates extreme floods are more severe in the twenty-first century, (4) one adaptation for the projected twenty-first century increase in precipitation (25-39%) and flood (2%-20%) extremes is to recharge Egypt's fossil aquifers during high flood years.
© 2024. The Author(s).
Conflict of interest statement
The authors declare no competing interests.
Figures


Similar articles
-
The effects of future nationwide forest transition to discharge in the 21st century with regard to general circulation model climate change scenarios.Environ Res. 2016 Aug;149:288-296. doi: 10.1016/j.envres.2016.01.024. Epub 2016 Feb 3. Environ Res. 2016. PMID: 26852164
-
Projected changes in flooding: a continental U.S. perspective.Ann N Y Acad Sci. 2020 Jul;1472(1):95-103. doi: 10.1111/nyas.14359. Epub 2020 May 9. Ann N Y Acad Sci. 2020. PMID: 32386267 Review.
-
Impacts of projected climate change on runoff in upper reach of Heihe River basin using climate elasticity method and GCMs.Sci Total Environ. 2020 May 10;716:137072. doi: 10.1016/j.scitotenv.2020.137072. Epub 2020 Feb 1. Sci Total Environ. 2020. PMID: 32069704
-
Climate change simulation and trend analysis of extreme precipitation and floods in the mesoscale Rur catchment in western Germany until 2099 using Statistical Downscaling Model (SDSM) and the Soil & Water Assessment Tool (SWAT model).Sci Total Environ. 2022 Sep 10;838(Pt 1):155775. doi: 10.1016/j.scitotenv.2022.155775. Epub 2022 May 13. Sci Total Environ. 2022. PMID: 35577086
-
The 2023 Latin America report of the Lancet Countdown on health and climate change: the imperative for health-centred climate-resilient development.Lancet Reg Health Am. 2024 Apr 23;33:100746. doi: 10.1016/j.lana.2024.100746. eCollection 2024 May. Lancet Reg Health Am. 2024. PMID: 38800647 Free PMC article. Review.
References
-
- Trenberth, K. E., Dai, A., Rasmussen, R. M. & Parsons, D. B. The changing character of precipitation. Bull. Am. Meteor. Soc.84(9), 1205–1218. 10.1175/BAMS-84-9-1205 (2003).
-
- Watterson, I. G. & Dix, M. R. Simulated changes due to global warming in daily precipitation means and extremes and their interpretation using the gamma distribution. J. Geophys. Res.108, 4379. 10.1029/2002JD002928 (2003).
-
- Trenberth, K. Changes in precipitation with climate change. Clim. Res.47, 123–138. 10.3354/cr00953 (2011).
-
- Westra, S. et al. Future changes to the intensity and frequency of short-duration extreme rainfall. Rev. Geophys.52, 522–555. 10.1002/2014RG000464 (2014).
-
- Donat, M., Lowry, A., Alexander, L., O’Gorman, P. & Maher, N. More extreme precipitation in the world’s dry and wet regions. Nat. Clim. Change6, 508–513. 10.1038/nclimate2941 (2016).
Grants and funding
- 80NSSC20K0767/National Aeronautics and Space Administration (NASA), Earth Science Division
- 80NSSC24K1155/National Aeronautics and Space Administration (NASA), Earth Science Division
- 80NSSC20K0767/National Aeronautics and Space Administration (NASA), Earth Science Division
- 80NSSC24K1155/National Aeronautics and Space Administration (NASA), Earth Science Division
- 80NSSC20K0767/National Aeronautics and Space Administration (NASA), Earth Science Division
- 80NSSC24K1155/National Aeronautics and Space Administration (NASA), Earth Science Division
- 80NSSC20K0767/National Aeronautics and Space Administration (NASA), Earth Science Division
- 80NSSC24K1155/National Aeronautics and Space Administration (NASA), Earth Science Division
- 80NSSC20K0767/National Aeronautics and Space Administration (NASA), Earth Science Division
- 80NSSC24K1155/National Aeronautics and Space Administration (NASA), Earth Science Division
LinkOut - more resources
Full Text Sources
Miscellaneous

