Comparative Study
. 1999 Jan;181(1):319-30.
doi: 10.1128/JB.181.1.319-330.1999.

Regulation of the sol locus genes for butanol and acetone formation in Clostridium acetobutylicum ATCC 824 by a putative transcriptional repressor

Affiliations
Comparative Study

Regulation of the sol locus genes for butanol and acetone formation in Clostridium acetobutylicum ATCC 824 by a putative transcriptional repressor

R V Nair et al. J Bacteriol. 1999 Jan.

Abstract

A gene (orf1, now designated solR) previously identified upstream of the aldehyde/alcohol dehydrogenase gene aad (R. V. Nair, G. N. Bennett, and E. T. Papoutsakis, J. Bacteriol. 176:871-885, 1994) was found to encode a repressor of the sol locus (aad, ctfA, ctfB and adc) genes for butanol and acetone formation in Clostridium acetobutylicum ATCC 824. Primer extension analysis identified a transcriptional start site 35 bp upstream of the solR start codon. Amino acid comparisons of SolR identified a potential helix-turn-helix DNA-binding motif in the C-terminal half towards the center of the protein, suggesting a regulatory role. Overexpression of SolR in strain ATCC 824(pCO1) resulted in a solvent-negative phenotype owing to its deleterious effect on the transcription of the sol locus genes. Inactivation of solR in C. acetobutylicum via homologous recombination yielded mutants B and H (ATCC 824 solR::pO1X) which exhibited deregulated solvent production characterized by increased flux towards butanol and acetone formation, earlier induction of aad, lower overall acid production, markedly improved yields of solvents on glucose, a prolonged solvent production phase, and increased biomass accumulation compared to those of the wild-type strain.


Figures
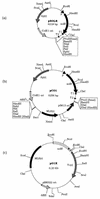
FIG. 1
FIG. 1
Schematic representations of the plasmids pSOLR (a), pCO1 (b), and pO1X (c). P is the solR promoter, and T1 and T2 are transcriptional terminators identified previously (42) downstream of solR. solR′ is the 0.9-kb internal fragment of solR (see construction of pO1X in Materials and Methods).
FIG. 2
FIG. 2
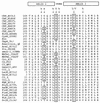
Amino acid alignment of the DNA-binding HTH domains of the CRP-FNR family of regulatory proteins. Hydrophobic residues (h) and conserved residues in three different positions (boxed) are indicated at the top. CRP_ECOLI, CRP (catabolite gene activator protein) from E. coli (46); CAP_KLEAE, CAP-like protein from Klebsiella aerogenes (44); CAP_SHIFL and CAP_SALTY, CAP from Shigella flexneri and Salmonella typhimurium, respectively (14); CRP_HAEIN, CRP from Haemophilus influenzae (10); CLP_XANCA, CAP-like protein from Xanthomonas campestris (16); CRP_SALTY, CRP from S. typhimurium (58); BifA_ANABA, CRP-like protein from Anabaena sp. (67); CysR_SYNEC, regulatory protein from Synechococcus sp. (31); Hin, product of DNA inversion gene (46); TnpR_Tn3, Tn3 resolvase (46); Resolvase_γδ, resolvase from transposon γδ (46); AraC_ECOLI, arabinose regulatory protein from E. coli (46); ftz_DROME, product of segmentation gene fushi tarazu from Drosophila melanogaster (32); smox-2_SCHMA, Schistosoma mansoni homeobox-containing DNA-binding protein (66); MATa1_YEAST and MATα2_YEAST, Saccharomyces cerevisiae proteins that specify a and α diploid functions including sporulation (32); Cro_434, regulatory protein from bacteriophage 434 (46); C2_P22, repressor from bacteriophage P22 (56); CI_φ80 and Gene30_φ80, DNA-binding proteins from bacteriophage φ80 (43); CII_λ, regulatory protein from bacteriophage λ (46); LacR_ECOLI, lactose repressor from E. coli (46); GalR_ECOLI, galactose repressor from E. coli (46); CI_λ, repressor from bacteriophage λ (55); Cro_λ, regulatory protein from bacteriophage λ (46); FNR_ECOLI, FNR from E. coli (46); HlyX_ACTPL, regulatory protein from Actinobacillus pleuropneumoniae (34); AadR_RHOPA, FNR-CRP member from Rhodopseudomonas palustris (18); FixK_RHILE, FNR-like protein from Rhizobium leguminosarum (12); FixK_RHIME, FNR-CRP member from Rhizobium meliloti (5); FixK_BRAJA, FNR-like protein from Bradyrhizobium japonicum (2); FLP_LACCA, FNR-like protein from Lactobacillus casei (28); SolR_CLOAC, putative repressor protein from Clostridium acetobutylicum. Numbers preceding sequences represent amino acid positions within each protein. Previously reported (32, 46) consensus sequence alignments were used.
FIG. 3
FIG. 3
Southern analysis. Hybridization of a 0.9-kb solR fragment to ScaI- or EcoRI-digested bacterial DNA from C. acetobutylicum mutant B (lanes c), mutant H (lanes d), wild-type (lanes b), and plasmid pO1X (lanes a and e). Size markers (in kilobase pairs) are BstEII-digested λ DNA.
FIG. 4
FIG. 4
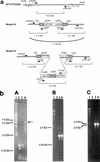
Schematic representations (a) and results of PCR analysis (b) on wild-type (WT) C. acetobutylicum ATCC 824 and solR mutants B and H using primers (a) designed to amplify the junction between the vector portion of pO1X and the solR gene. For each gel in panel b, lane 1 contains HindIII-digested lambda marker, lane 2 contains the WT genomic template, lane 3 contains the solR mutant B template, and lane 4 contains the solR mutant H as the template. (Gel A) Extralong PCR using primers solR453 and solR1361 designed to amplify the complete insert. In lane 2, WT DNA shows an expected ∼0.9-kb band. This band is also seen, but much weaker, in both lanes 3 and 4. In addition, lane 4 contains a band with an apparent size of ∼7 kb (marked with an arrow), consistent with the presence of one insert of pO1X into solR of mutant H. (Gel B) PCR results using primers solR453 and Tc238. A band of ∼1.2 kb can be seen in lanes 3 and 4 with no product in lane 2. (Gel C) PCR results using primers Em373 and solR1361. A band of ∼2.1 kb is visible in lanes 3 and 4. Again, no product was observed with WT DNA (lane 2).
FIG. 5
FIG. 5
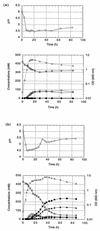
Product concentration and optical density (OD) profiles for controlled-pH (pH ≥ 4.5) batch fermentations with C. acetobutylicum strain ATCC 824(pCO1) (a) and mutant B (b). Zero time indicates the time at which the bioreactor was inoculated with a 1/10 (vol/vol) preculture. Symbols: ⊞, glucose; •, ethanol; ▴, acetone; ■, butanol; ○, acetate; □, butyrate; ▵, optical density at 600 nm; ⊙, pH.
FIG. 6
FIG. 6
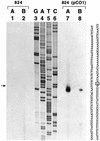
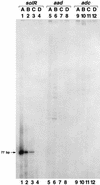
Primer extension analysis. Primer extension products made with primer BORFU-PE complementary to the N-terminal end of solR are shown. RNA for these experiments was obtained from C. acetobutylicum ATCC 824 cells (lanes 1 and 2) and from C. acetobutylicum ATCC 824(pCO1) cells (lanes 7 and 8). Cell samples were collected during early exponential (stage A, 5 h) and late exponential (stage B, 10 h) growth phases. The late exponential growth phase is also the solventogenic phase of ATCC 824 cells. Regions of the plasmid pCO1 were sequenced with the same primer, and the resulting DNA sequences are shown in lanes 3 to 6. The corresponding 5′-to-3′ DNA sequence of the complementary (coding) strand is indicated to the right of the gel (sequence continues onto a second line), wherein the boxed nucleotide is the transcriptional start site. The arrow indicates the position of the nearly invisible bands in lanes 1 and 2. The total RNA (20 μg) used for lanes 7 and 8 corresponding to strain ATCC 824(pCO1) was the same as that loaded in primer extension reactions performed previously (42) to map the transcriptional start site of aad. However, low transcriptional levels are characteristic of regulatory proteins, since they are present in low copy numbers and hence, on this suspicion, twice the standard amount of total RNA (40 μg) was used for lanes 1 and 2 (corresponding to wild-type strain ATCC 824) in order to obtain visible bands.
FIG. 7
FIG. 7
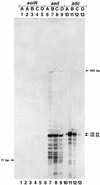
Time course primer extension analysis of ATCC 824(pCO1) cells. RNA for the time course primer extension experiments was isolated from ATCC 824(pCO1) cells isolated during the early exponential growth (stage A, 5 h), late exponential growth (stage B, 10 h), early stationary (stage C, 25 h), and late stationary (stage D, 50 h) stages in a batch fermentation with a controlled pH (pH 4.5). The presence of mRNA corresponding to solR (lanes 1 to 4) aad (lanes 5 to 8) and adc (lanes 9 to 12) genes in each of the above four stages was verified by performing primer extension reactions with 20 μg of total RNA, using end-labeled 20-mer synthetic oligonucleotides BORFU-PE, BYDH-PE, and N-ADC that are complementary to the N-terminal ends of the respective genes.
FIG. 8
FIG. 8
Time course primer extension analysis of mutant B cells. RNA for the time course primer extension experiments was isolated from mutant B cells sampled from the early exponential growth (stage A, 5 h), late exponential growth (stage B, 10 h), early stationary (stage C, 25 h), and late stationary (stage D, 50 h) stages in a batch fermentation with a controlled pH (pH ≥ 4.5). An early exponential growth phase (stage A) sample from an ATCC 824 pH 4.5 fermentation was examined for the solR transcript (lane 1). The presence of mRNA corresponding to solR (lanes 2 to 5), aad (lanes 6 to 9), and adc (lanes 10 to 13) genes in each of the above four stages was verified by performing primer extension reactions with 20 μg of total RNA, using end-labeled 20-mer synthetic oligonucleotides BORFU-PE, BYDH-PE, and N-ADC that are complementary to the N-terminal ends of the respective genes.
FIG. 9
FIG. 9
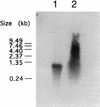
Northern analysis. Total RNA was prepared from exponential-phase ATCC 824 (lane 1) and mutant B (lane 2) cells from pH ≥ 4.5 fermentations and probed with the solR internal fragment from pO1X.

Similar articles

Cited by

References

    1. Altschul S F, Madden T L, Schäffer A A, Zhang J, Zhang Z, Miller W, Lipman D J. Gapped BLAST and PSI-BLAST: a new generation of protein database search programs. Nucleic Acids Res. 1997;25:3389–3402. - PMC - PubMed
    1. Anthamatten D, Scherb B, Hennecke H. Characterization of a fixLJ-regulated Bradyrhizobium japonicum gene sharing similarity with the Escherichia coli fnr and Rhizobium meliloti fixK genes. J Bacteriol. 1992;174:2111–2120. - PMC - PubMed
    1. Attwood T K, Beck M E, Flower D R, Scordis P, Selley J N. The PRINTS protein fingerprint database in its fifth year. Nucleic Acids Res. 1998;26:304–308. - PMC - PubMed
    1. Bairoch, A. 1991. PROSITE: a dictionary of sites and patterns in proteins. Nucleic Acids Res. 19(Suppl.):2241–2245. - PMC - PubMed
    1. Batut J, Daveran-Mingot M-L, David M, Jacobs J, Garnerone A M, Kahn D. fixK, a gene homologous with fnr and crp from Escherichia coli, regulates nitrogen fixation genes both positively and negatively in Rhizobium meliloti. EMBO J. 1989;8:1279–1286. - PMC - PubMed

Publication types

MeSH terms

Associated data

LinkOut - more resources

  NODES
INTERN 2
twitter 2