Comparative Study
. 2001 Mar;107(6):703-15.
doi: 10.1172/JCI9997.

A novel vascular smooth muscle chymase is upregulated in hypertensive rats

Affiliations
Comparative Study

A novel vascular smooth muscle chymase is upregulated in hypertensive rats

C Guo et al. J Clin Invest. 2001 Mar.

Abstract

While greater than 80% of angiotensin II (Ang II) formation in the human heart and greater than 60% in arteries appears to result from chymase activity, no cardiovascular cell-expressed chymase has been previously reported. We now describe the cloning of a full-length cDNA encoding a novel chymase from rat vascular smooth muscle cells. The cDNA encompasses 953 nucleotides, encodes 247 amino acids, and exhibits 74% and 80% homology in amino acid sequence to rat mast cell chymase I and II, respectively. Southern blot analysis indicates that the rat vascular chymase is encoded by a separate gene. This chymase was induced in hypertrophied rat pulmonary arteries, with 11-fold and 8-fold higher chymase mRNA levels in aortic and pulmonary artery smooth muscle cells from spontaneously hypertensive than in corresponding tissues from normotensive rats. We assayed the activity of the endogenous enzyme and of a recombinant, epitope-tagged chymase in transfected smooth muscle cells and showed that Ang II production from Ang I can be inhibited with chymostatin, but not EDTA or captopril. Spontaneously hypertensive rats show elevated chymase expression and increased chymostatin-inhibitable angiotensin-converting activity, suggesting a possible role for this novel enzyme in the pathophysiology of hypertension.


Figures
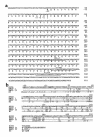
Figure 1
Figure 1
Nucleotide sequence and deduced amino acid sequence of RVCH. (a) The nucleotide sequences annealing to the degenerate primer (DG), the primer used for 5′-RACE cDNA synthesis (CD), and the PCR primer (PR) are underlined as described in Methods. The deduced amino acid (aa) sequence contains an 18-aa signal peptide (–20 to –3), a 2-aa proenzyme (–2 to –1), and the mature enzyme (aa 1 to 227). The catalytic triad of amino acid (His45, Asp89, and Ser182), conserved Cys (C) residues, and a conserved sequence for serine proteases at the NH2-terminal (IIGGVE) are in boldface. The sequence is available under GenBank accession number AF063851. (b) Comparison of amino acid sequence of RVCH with other chymases. The deduced amino acid sequence of RVCH is aligned with those of RMCP I, RMCP II, and human chymase (HC). The residues identical to those of RVCH are indicated with hyphens. The conserved catalytic triad, Cys residues, and the conserved sequence for serine proteases (IIGGVE) are in boldface.
Figure 2
Figure 2
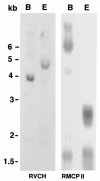
Southern blot analysis of the RVCH gene. Rat genomic DNA was digested with BamHI (B) and EcoRI (E). The blot was hybridized with the 5′-RACE fragment of RVCH and RMCP II cDNA. The membrane was washed with 2× SSC/0.1% at room temperature, followed by SDS 0.1× SSC/0.1% SDS at 68°C. The pattern of bands detected by the 5′-RACE fragment of RVCH was different from that detected with RMCP II cDNA.
Figure 3
Figure 3
Expression of the RVCH in different tissues and cells. (a) RT-PCR was performed on mRNA from Sprague-Dawley pulmonary artery (PA) SMCs (lane 1), aorta (AO) SMCs (lane 2), A10 cells (lane 3), PA (lane 4), AO (lane 5), heart (lane 6), kidney (lane 7), lung (lane 8), muscle (lane 9), rat mast cell line RBL-1 (lane 10), rat mast cell line RBL-2H3 (lane 11), rat B-cell line GP21:56 (lane 12), rat fetus fibroblast cell line Rat 2 (lane 13), and negative control (lane 14). (b) SHR cells and tissues visualized were: PA SMCs (lane 1), AO SMCs (lane 2), PA (lane 3), AO (lane 4), heart (lane 5), lung (lane 6), kidney (lane 7), liver (lane 8), muscle (lane 9), and Sprague-Dawley PA SMCs (lane 10) as a positive control and negative control (lane 11). GAPDH cDNA was amplified as a control for cDNA quality. The base-pair sizes of commercially prepared markers (lane M) are indicated on the left.
Figure 4
Figure 4
In situ hybridization analysis of RVCH mRNA expression in pulmonary hypertension. Representative photomicrographs of in situ hybridization with digoxigenin-labeled RVCH antisense (c and f) and sense (b and e) riboprobes in PA from rats 21 days after monocrotaline (d, e, and f) and saline injection (a, b and c). RVCH mRNA expression appears as dark blue staining (arrow) and is only detectable in monocrotaline-treated rats. Movat pentachrome staining shows PA hypertrophy in monocrotaline-treated rats (d) compared with saline-treated rats (a).
Figure 5
Figure 5
Northern blot analysis of RVCH mRNA levels. Total RNA from Sprague-Dawley PA SMCs, AO SMCs, A10 cell line, SHR PA SMCs, and AO SMCs was used for Northern blot analysis of RVCH mRNA levels. (a) A representative blot showed a single 1.3-kb mRNA band in all samples detected using the full-length RVCH cDNA (953 nucleotide) probe. The membrane was then stripped and rehybridized with a GAPDH probe as a control. (b) Densitometric quantification of Northern blots revealed a significant increase in the RVCH/GAPDH ratio in SHR versus Sprague-Dawley in both AO and PA. The data are depicted as mean ± SEM of three independent experiments. AP < 0.05 versus Sprague-Dawley.
Figure 6
Figure 6
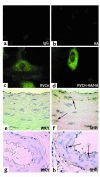
(ad) Localization of endogenous RVCH and recombinant RVCH-HA tag in transfected A10 cells. Staining with the peptide Ab (c) or an anti-HA tag Ab (d) revealed a similar punctate immunofluorescent staining in cytosol of representative A10 cells. As expected, the intensity of immunostaining was higher in the RVCH-HA–transfected (RVCH-HA/HA) than in the vector-transfected cell, stained with the anti-HA Ab and Ab against peptide A, respectively. A similar result was obtained with Ab against peptide B. Negative controls are shown using rabbit IgG (a) and an Ab to HA tag (b) in nontransfected cells. ×100. (eh) Immunohistochemical staining of RVCH in AO and mesentery artery from WKY and SHR rats. Immunoperoxidase staining of AO (f) and mesentery artery (h) sections reveals immunodetection of RVCH (arrows) in medial SMCs in 8-week-old SHR rats, but no staining was found in an AO (e) or mesentery artery (g) from an age-matched WKY rat. ×100. These results were obtained using the Ab against peptide B, described in the text. Representative of n = 3 per group.
Figure 7
Figure 7
Western blot analysis shows increased RVCH in SMC from SHR versus WKY rats. Total protein (10 mg) was resolved using an 8–16% gradient Tris-glycine gel. A peptide Ab that is specific to RVCH was used as the primary Ab. A similar result was obtained with the Ab against peptide A or B. (a) A representative Western blot showed a specific band for 30-kDa RVCH. (b) Densitometric evaluation of RVCH in SMCs reveals an increase in SHR versus WKY rats. (c) Chymase activity was increased in aortic SMCs from SHR versus WKY rats. The data are depicted as the mean ± SEM of four experiments. AP < 0.05 versus WKY-transfected, but not pcDNA-transfected (vector alone), A10 cells.
Figure 8
Figure 8
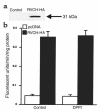
Expression of recombinant RVCH in A10 cells. (a) The expression of recombinant RVCH was detected by Western blot analysis in cell lysates of HA-tagged RVCH-transfected, but not pcDNA-transfected, A10 cells, using a high-affinity mAb against HA (RVCH + HA = 31 kDa). (b) Chymase activity increased 8.5-fold in A10 cells stably transfected with RVCH cDNA construct compared with those transfected with the control vector pcDNA. Chymase activity does not increase after addition of 0.1 units of DPPI in A10 cells transfected with the RVCH cDNA construct or in control vector–transfected cells. The data are depicted as mean ± SEM of three independent experiments. P < 0.05, RVCH versus pcDNA.
Figure 9
Figure 9
(a) Conversion of Ang II from Ang I by A10 cell extracts. Ang I was incubated with A10 cell extracts and analyzed using HPLC. The separated peaks were collected for molecular-weight analysis by mass spectrophotometer. The fragments contained in different peaks are illustrated below the figures. Chymostatin eliminated peak B (Ile5-His6-Pro7-Phe8) and the Ang II component of peak D (Asp1 to Phe8). Captopril could not inhibit the generation of Ang II, suggesting that the cleavage at the Phe8-His9 bond is the result of a chymase rather than angiotensin-converting enzyme. (b) Cleavage of the Tyr4-Ile5 bond in Ang II cannot be inhibited by chymostatin. Ang II was incubated with A10 cell extracts and analyzed by HPLC. Peak A contains Ile5-His6-Pro7-Phe8. Peak B contains Ang II (Asp1 to Phe8). Addition of chymostatin cannot inhibit cleavage of the Tyr4-Ile5 bond.
Figure 10
Figure 10
Conversion of Ang I to Ang II by immunoprecipitated recombinant RVCH. Cell lysates from pcDNA and HA-tagged RVCH-transfected A10 cells were immunoprecipitated with high-affinity mAb against HA. Ang I was incubated with immunoprecipitated RVCH and analyzed using HPLC. The separated peaks were collected for molecular-weight analysis by mass spectrophotometry. Conversion of Ang I to Ang II was confirmed only when Ang I was incubated with immunoprecipitated protein from HA-tagged RVCH. Chymostatin eliminated the Ang II peak. Captopril could not inhibit the generation of Ang II, suggesting that the cleavage at the Phe8-His9 bond is the result of a chymase rather than angiotensin-converting enzyme.
Figure 11
Figure 11
The kinetics of Ang II formation from Ang I by purified vascular chymase. Purified chymase was incubated with 10–600 μM Ang I at 37°C for 20 minutes. Ang II generated was analyzed using HPLC, followed by radioimmunoassay. Values shown in this figure represent the mean of four independent experiments. Km, Vmax, and Kcat were calculated using the Lineweaver-Burk plot.
Figure 12
Figure 12
Conversion of Ang I to Ang II by intact SMCs. RVCH-HA–transfected and vector-transfected A10 cells, as well as SMCs from SHR and WKY rats, were incubated with Ang I (1 pM) for 1 hour. In some experiments, SMCs were preincubated with the chymase inhibitor, chymostatin, for 15 minutes before the addition of Ang I. SMCs were harvested, and Ang II was separated using HPLC subsequent to quantification by radioimmunoassay. Values given are mean ± SEM of four independent experiments. AP < 0.05 versus all other groups.

Similar articles

Cited by

References

    1. Morrell NW, Atochina EN, Morris KG, Danilov SM, Stenmark KR. Angiotensin converting enzyme expression is increased in small pulmonary arteries of rats with hypoxia-induced pulmonary hypertension. J Clin Invest. 1995;96:1823–1833. - PMC - PubMed
    1. Morrell NW, Morris KG, Stenmark KR. Role of angiotensin-converting enzyme and angiotensin II in development of hypoxic pulmonary hypertension. Am J Physiol. 1995;269:H1186–H1194. - PubMed
    1. Danser AH, Schalekamp MA. Is there an internal cardiac renin-angiotensin system? Heart. 1996;76(Suppl. 3):28–32. - PMC - PubMed
    1. Rosendorff C. Vascular hypertrophy in hypertension: role of the renin-angiotensin system. Mt Sinai J Med. 1998;65:108–117. - PubMed
    1. Curzen NP, Fox KM. Do ACE inhibitors modulate atherosclerosis? Eur Heart J. 1997;18:1530–1535. - PubMed

Publication types

MeSH terms

Associated data

  NODES
INTERN 1
twitter 2