CellProfiler: image analysis software for identifying and quantifying cell phenotypes
- PMID: 17076895
- PMCID: PMC1794559
- DOI: 10.1186/gb-2006-7-10-r100
CellProfiler: image analysis software for identifying and quantifying cell phenotypes
Abstract
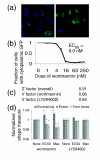
Biologists can now prepare and image thousands of samples per day using automation, enabling chemical screens and functional genomics (for example, using RNA interference). Here we describe the first free, open-source system designed for flexible, high-throughput cell image analysis, CellProfiler. CellProfiler can address a variety of biological questions quantitatively, including standard assays (for example, cell count, size, per-cell protein levels) and complex morphological assays (for example, cell/organelle shape or subcellular patterns of DNA or protein staining).
Figures


Similar articles
-
CellProfiler: free, versatile software for automated biological image analysis.Biotechniques. 2007 Jan;42(1):71-5. doi: 10.2144/000112257. Biotechniques. 2007. PMID: 17269487
-
CellProfiler Analyst: data exploration and analysis software for complex image-based screens.BMC Bioinformatics. 2008 Nov 15;9:482. doi: 10.1186/1471-2105-9-482. BMC Bioinformatics. 2008. PMID: 19014601 Free PMC article.
-
An open-source solution for advanced imaging flow cytometry data analysis using machine learning.Methods. 2017 Jan 1;112:201-210. doi: 10.1016/j.ymeth.2016.08.018. Epub 2016 Sep 2. Methods. 2017. PMID: 27594698 Free PMC article.
-
Applications in image-based profiling of perturbations.Curr Opin Biotechnol. 2016 Jun;39:134-142. doi: 10.1016/j.copbio.2016.04.003. Epub 2016 Apr 17. Curr Opin Biotechnol. 2016. PMID: 27089218 Review.
-
Image-based chemical screening.Nat Chem Biol. 2007 Aug;3(8):461-5. doi: 10.1038/nchembio.2007.15. Nat Chem Biol. 2007. PMID: 17637778 Review.
Cited by
-
Fibroblast growth factor signalling in multiple sclerosis: inhibition of myelination and induction of pro-inflammatory environment by FGF9.Brain. 2015 Jul;138(Pt 7):1875-93. doi: 10.1093/brain/awv102. Epub 2015 Apr 22. Brain. 2015. PMID: 25907862 Free PMC article.
-
Rab6 regulation of the kinesin family KIF1C motor domain contributes to Golgi tethering.Elife. 2015 Mar 30;4:e06029. doi: 10.7554/eLife.06029. Elife. 2015. PMID: 25821985 Free PMC article.
-
Simultaneous analysis of large-scale RNAi screens for pathogen entry.BMC Genomics. 2014 Dec 22;15(1):1162. doi: 10.1186/1471-2164-15-1162. BMC Genomics. 2014. PMID: 25534632 Free PMC article.
-
A dual decoder U-Net-based model for nuclei instance segmentation in hematoxylin and eosin-stained histological images.Front Med (Lausanne). 2022 Nov 11;9:978146. doi: 10.3389/fmed.2022.978146. eCollection 2022. Front Med (Lausanne). 2022. PMID: 36438040 Free PMC article.
-
Topographically-patterned porous membranes in a microfluidic device as an in vitro model of renal reabsorptive barriers.Lab Chip. 2013 Jun 21;13(12):2311-9. doi: 10.1039/c3lc50199j. Epub 2013 May 2. Lab Chip. 2013. PMID: 23636129 Free PMC article.
References
-
- Moffat J, Grueneberg DA, Yang X, Kim SY, Kloepfer AM, Hinkle G, Piqani B, Eisenhaure TM, Luo B, Grenier JK, et al. A lentiviral RNAi library for human and mouse genes applied to an arrayed viral high-content screen. Cell. 2006;124:1283–1298. - PubMed
-
- Dasgupta R, Perrimon N. Using RNAi to catch Drosophila genes in a web of interactions: insights into cancer research. Oncogene. 2004;23:8359–8365. - PubMed
-
- Carpenter AE, Sabatini DM. Systematic genome-wide screens of gene function. Nat Rev Genet. 2004;5:11–22. - PubMed
-
- Vanhecke D, Janitz M. Functional genomics using high-throughput RNA interference. Drug Discov Today. 2005;10:205–212. - PubMed
-
- Echeverri CJ, Perrimon N. High-throughput RNAi screening in cultured cells: a user's guide. Nat Rev Genet. 2006;7:373–384. - PubMed
Publication types
MeSH terms
Grants and funding
LinkOut - more resources
Full Text Sources
Other Literature Sources

