An APOBEC cytidine deaminase mutagenesis pattern is widespread in human cancers
- PMID: 23852170
- PMCID: PMC3789062
- DOI: 10.1038/ng.2702
An APOBEC cytidine deaminase mutagenesis pattern is widespread in human cancers
Abstract
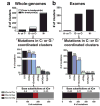
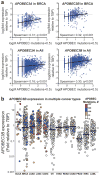
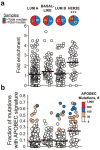
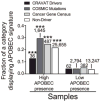
Recent studies indicate that a subclass of APOBEC cytidine deaminases, which convert cytosine to uracil during RNA editing and retrovirus or retrotransposon restriction, may induce mutation clusters in human tumors. We show here that throughout cancer genomes APOBEC-mediated mutagenesis is pervasive and correlates with APOBEC mRNA levels. Mutation clusters in whole-genome and exome data sets conformed to the stringent criteria indicative of an APOBEC mutation pattern. Applying these criteria to 954,247 mutations in 2,680 exomes from 14 cancer types, mostly from The Cancer Genome Atlas (TCGA), showed a significant presence of the APOBEC mutation pattern in bladder, cervical, breast, head and neck, and lung cancers, reaching 68% of all mutations in some samples. Within breast cancer, the HER2-enriched subtype was clearly enriched for tumors with the APOBEC mutation pattern, suggesting that this type of mutagenesis is functionally linked with cancer development. The APOBEC mutation pattern also extended to cancer-associated genes, implying that ubiquitous APOBEC-mediated mutagenesis is carcinogenic.
Conflict of interest statement
The authors declare no competing financial interests.
Figures


Comment in
-
Genetics: APOBEC-a double-edged sword.Nat Rev Clin Oncol. 2013 Sep;10(9):488. doi: 10.1038/nrclinonc.2013.138. Epub 2013 Jul 30. Nat Rev Clin Oncol. 2013. PMID: 23897082 No abstract available.
-
APOBEC3B mutagenesis in cancer.Nat Genet. 2013 Sep;45(9):964-5. doi: 10.1038/ng.2736. Nat Genet. 2013. PMID: 23985681 Free PMC article.
-
Genomics: Mutator catalogues.Nat Rev Cancer. 2013 Oct;13(10):681. doi: 10.1038/nrc3608. Nat Rev Cancer. 2013. PMID: 24060860 No abstract available.
Similar articles
-
The role of distinct APOBEC/ADAR mRNA levels in mutational signatures linked to aging and ultraviolet radiation.Sci Rep. 2024 Jul 4;14(1):15395. doi: 10.1038/s41598-024-64986-6. Sci Rep. 2024. PMID: 38965255 Free PMC article.
-
Mutagenesis of apobec-1, the catalytic subunit of the mammalian apolipoprotein B mRNA editing enzyme, reveals distinct domains that mediate cytosine nucleoside deaminase, RNA binding, and RNA editing activity.J Biol Chem. 1995 Jun 16;270(24):14768-75. J Biol Chem. 1995. PMID: 7782343
-
Hypomorphic mutation in the large subunit of replication protein A affects mutagenesis by human APOBEC cytidine deaminases in yeast.G3 (Bethesda). 2024 Oct 7;14(10):jkae196. doi: 10.1093/g3journal/jkae196. G3 (Bethesda). 2024. PMID: 39150943 Free PMC article.
-
Apolipoprotein B mRNA editing enzyme catalytic polypeptide-like family genes activation and regulation during tumorigenesis.Cancer Sci. 2018 Aug;109(8):2375-2382. doi: 10.1111/cas.13658. Epub 2018 Jun 28. Cancer Sci. 2018. PMID: 29856501 Free PMC article. Review.
-
Addressing the benefits of inhibiting APOBEC3-dependent mutagenesis in cancer.Nat Genet. 2022 Nov;54(11):1599-1608. doi: 10.1038/s41588-022-01196-8. Epub 2022 Oct 24. Nat Genet. 2022. PMID: 36280735 Free PMC article. Review.
Cited by
-
APOBEC Enzymes: Mutagenic Fuel for Cancer Evolution and Heterogeneity.Cancer Discov. 2015 Jul;5(7):704-12. doi: 10.1158/2159-8290.CD-15-0344. Epub 2015 Jun 19. Cancer Discov. 2015. PMID: 26091828 Free PMC article. Review.
-
The DNA cytosine deaminase APOBEC3B promotes tamoxifen resistance in ER-positive breast cancer.Sci Adv. 2016 Oct 7;2(10):e1601737. doi: 10.1126/sciadv.1601737. eCollection 2016 Oct. Sci Adv. 2016. PMID: 27730215 Free PMC article.
-
Exploring the Role of Clustered Mutations in Carcinogenesis and Their Potential Clinical Implications in Cancer.Int J Mol Sci. 2024 Jun 19;25(12):6744. doi: 10.3390/ijms25126744. Int J Mol Sci. 2024. PMID: 38928450 Free PMC article. Review.
-
Rapid and dynamic transcriptome regulation by RNA editing and RNA modifications.J Cell Biol. 2016 Apr 11;213(1):15-22. doi: 10.1083/jcb.201511041. Epub 2016 Apr 4. J Cell Biol. 2016. PMID: 27044895 Free PMC article. Review.
-
Association of germline variants in the APOBEC3 region with cancer risk and enrichment with APOBEC-signature mutations in tumors.Nat Genet. 2016 Nov;48(11):1330-1338. doi: 10.1038/ng.3670. Epub 2016 Sep 19. Nat Genet. 2016. PMID: 27643540 Free PMC article.
References
-
- Hanahan D, Weinberg RA. Hallmarks of cancer: the next generation. Cell. 2011;144:646–74. - PubMed
-
- Loeb LA. Mutator phenotype may be required for multistage carcinogenesis. Cancer Res. 1991;51:3075–9. - PubMed
-
- Luch A. Nature and nurture - lessons from chemical carcinogenesis. Nat Rev Cancer. 2005;5:113–25. - PubMed
-
- Conticello SG. Creative deaminases, self-inflicted damage, and genome evolution. Ann N Y Acad Sci. 2012;1267:79–85. - PubMed
-
- Pavri R, Nussenzweig MC. AID _targeting in antibody diversity. Advances in immunology. 2011;110:1–26. - PubMed
Publication types
MeSH terms
Substances
Grants and funding
LinkOut - more resources
Full Text Sources
Other Literature Sources
Research Materials
Miscellaneous

