. 2021 Mar;9(3):e001536.
doi: 10.1136/jitc-2020-001536.

Tumor-derived ILT4 induces T cell senescence and suppresses tumor immunity

Affiliations

Tumor-derived ILT4 induces T cell senescence and suppresses tumor immunity

Aiqin Gao et al. J Immunother Cancer. 2021 Mar.

Abstract

Background: Current immunotherapies including checkpoint blockade therapy have limited success rates in certain types of cancers. Identification of alternative checkpoint molecules for the development of effective strategies for tumor immunotherapy is urgently needed. Immunoglobulin-like transcript 4 (ILT4) is an immunosuppressive molecule expressed in both myeloid innate cells and malignant tumor cells. However, the role of tumor-derived ILT4 in regulating cancer biology and tumor immunity remains unclear.

Methods: ILT4 expression in tumor cells and patient samples was determined by real-time PCR, flow cytometry, and immunohistochemistry. T cell senescence induced by tumor was evaluated using multiple markers and assays. Moreover, metabolic enzyme and signaling molecule expression and lipid droplets in tumor cells were determined using real-time PCR, western blot and oil red O staining, respectively. Loss-of-function and gain-of-function strategies were used to identify the causative role of ILT4 in tumor-induced T cell senescence. In addition, breast cancer and melanoma mouse tumor models were performed to demonstrate the role of ILT4 as a checkpoint molecule for tumor immunotherapy.

Results: We reported that ILT4 is highly expressed in human tumor cells and tissues, which is negatively associated with clinical outcomes. Furthermore, tumor-derived ILT4/PIR-B (ILT4 ortholog in mouse) is directly involved in induction of cell senescence in naïve/effector T cells mediated by tumor cells in vitro and in vivo. Mechanistically, ILT4/PIR-B increases fatty acid synthesis and lipid accumulation in tumor cells via activation of MAPK ERK1/2 signaling, resulting in promotion of tumor growth and progression, and induction of effector T cell senescence. In addition, blocking tumor-derived PIR-B can reprogram tumor metabolism, prevent senescence development in tumor-specific T cells, and enhance antitumor immunity in both breast cancer and melanoma mouse models.

Conclusions: These studies identify a novel mechanism responsible for ILT4-mediated immune suppression in the tumor microenvironment, and prove a novel concept of ILT4 as a critical checkpoint molecule for tumor immunotherapy.

Keywords: adoptive; biomarkers; immune evation; immunotherapy; lymphocytes; tumor; tumor microenvironment; tumor-Infiltrating.


Conflict of interest statement

Competing interests: None declared.

Figures
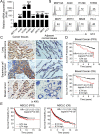
Figure 1
Figure 1
Upregulated immunoglobulin-like transcript 4 (ILT4) expression in human tumors predicts poor patient survival. (A, B) Gene and protein expression levels of ILT4 were upregulated in different human cancer cell lines using real-time quantitative PCR (qPCR) and flow cytometry analyses. Tumor cell lines included non-small cell lung cancer (NSCLC) (A549, H1299, H1650), breast cancer (MCF7, ZR751), melanoma (M628), and prostate cancer (PC-3). The mammary gland endothelial cell line (MCF10A) was included as a control. mRNA levels in each cell line were normalized to the relative quantity of β-actin expression and then adjusted to ILT4 level in MCF10A cells (served as 1). Results shown in the histogram are mean ± SD from three independent experiments. ***p<0.001 compared with MCF10A cells (in A). Protein levels in cell lines were determined using the flow cytometry analysis (in B). (C) ILT4 expression was highly increased in NSCLC and breast cancer tissues but rare in the adjacent normal tissues analyzed by the immunohistochemical staining. The positive staining was displayed as brown granules and mainly observed in the membrane and cytoplasm of tumor cells. Scale bar: 20 µm. (D, E) ILT4 expression levels in human breast cancer (in D) and NSCLC (in E) tissues were negatively associated with patient progress-free survival (PFS) and overall survival (OS). Transcriptional expression levels of ILT4 and patient survival information in patients with breast cancer and NSCLC were obtained from the GEO database. One hundred fifty-nine patients with breast cancer from GSE1456 dataset were included for PFS and OS analysis with the cut-off value of 6.37. While the sample sizes for pooled PFS and OS analysis in patients with NSCLC were 1926 and 982, respectively, and the best cut-off values were auto-selected by the online tool of KM-plotter database. The relationships between ILT4 and patient survivals were further verified by the Kaplan-Meier survival analysis and the log-rank (Mantel-Cox) test.
Figure 2
Figure 2
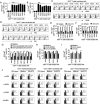
Tumor-derived immunoglobulin-like transcript 4 (ILT4) is responsible for T cell senescence. (A, B) Coculture with different tumor cells significantly increased SA-β-Gal+ T cell populations in cocultured CD4+ (in A) and CD8+ (in B) T cells. However, T cells cocultured with the breast epithelial cell line MCF10A had no or little senescence-associated β-galactosidase (SA-β-Gal) expression. Anti-CD3 pre-activated naïve T cells were cocultured with tumor cells or control MCF10A cells at a ratio of 1:1 for 24 hours. Cocultured CD4+ and CD8+ T cells were then separated and cultured for additional 3 days for SA-β-Gal activity analyses. Tumor cell lines included non-small cell lung cancer (NSCLC) (A549, H1299 and H1650), breast cancer (MCF7 and ZR751), melanoma (M628) and prostate cancer (PC-3). Results shown in the histograms are mean ± SD from three independent experiments. ***p<0.001. (C, D) Tumor cell treatment decreased expression of costimulatory molecules CD27 and CD28 (in C) but upregulated expression of cell cycle regulatory molecules P53 and P21 (in D) in senescent T cells. Cell treatment and procedure were the same as in (A). Expression levels of CD27, CD28, P53, and P21 in cocultured T cells were analyzed by the flow cytometry analyses. (E, F) Blockade of ILT4 through an anti-ILT4 neutralizing antibody remarkably prevented tumor-induced senescence in both CD4+ (in E) and CD8+ (in F) T cells. The cell coculture procedures are identical to (A) and (B). Anti-ILT4 neutralizing antibody (500 ng/mL) or isotype control antibody were included in the coculture system. Results shown in the histogram are mean ± SD from three independent experiments. **p<0.01 and ***p<0.001. (G) Tumor cells but not T cells pretreated with anti-ILT4 antibody decreased SA-β-Gal+ cell populations in cocultured CD4+ T cells. Different tumor cells or anti-CD3 pre-activated naïve CD4+ T cells were pretreated with anti-ILT4 antibody (500 ng/mL) for 2 hours, and then cocultured with untreated T cells or tumor cells, respectively, as described in (A). Results shown in the histogram are mean ± SD from three independent experiments. **p<0.01 and ***p<0.001. (H) Knockdown of ILT4 in tumor cells prevented T cell senescence induced by tumor cells. Tumor cell lines (A549, H1299, ZR751 and M628) with ILT4 high expression were infected with lentivirus carrying ILT4 shRNA or control shRNA at the multiplicity of infection (MOI) of 5–10 for 48 hours and then cocultured with T cells as described in (A) and (B). SA-β-Gal+ cell populations in cocultured CD4+ T cells were determined. Results shown in the histogram are mean ± SD from three independent experiments. *p<0.05, **p<0.01, and ***p<0.001, compared with the control shRNA (LV-Ctr-shRNA) group. (I) Overexpression of ILT4 in tumor cells promoted T cell senescence induced by tumor cells. Tumor cell lines (H1650, MCF7, and PC-3) with ILT4 low expression were infected with lentivirus carrying ILT4 or control vector at the MOI of 5–10 for 48 hours and then cocultured with T cells as described in (A) and (B). SA-β-Gal+ cell populations in cocultured CD4+ T cells were determined. Results shown in the histogram are mean ± SD from three independent experiments. *p<0.05 and **p<0.01, compared with the control vector group. (J) Blockade of ILT4 prevented tumor-induced DNA damage response in CD4+ T cells. Different tumor cells were pretreated with anti-ILT4 neutralizing antibody (500 ng/mL) for 2 hours, then cocultured with anti-CD3 pre-activated naïve CD4+ T cells at the ratio of 1:1 for 24 hours. Cocultured CD4+ T cells were separated and cultured for additional 3 days. Phosphorylation levels of ATM, H2AX, CHK2, and 53BP1 in cocultured T cells were analyzed by the flow cytometry analyses.
Figure 3
Figure 3
HLA-G is important for tumor-derived immunoglobulin-like transcript 4 (ILT4)-induced T cell senescence. (A) HLA-G is expressed in naïve, activated and senescent CD4+ and CD8+ T cells. Naïve CD4+ and CD8+ T cells were purified from peripheral blood mononuclear cells (PBMCs) of healthy donors. Activated T cells were obtained from naïve T cells cultured in the plate-coated anti-CD3/CD28 (2 µg/mL) for 24 hours. Senescent T cells were induced from pre-activated naïve CD4+/CD8+ T cells cocultured with human lung cancer A549 cells as described in figure 2A. HLA-G expression was determined by intracellular staining with the flow cytometry analysis. (B) HLA-G expression in human non-small cell lung cancer (NSCLC) (A549, H1299 and H1650), breast cancer (MCF7 and ZR751), melanoma (M628) and prostate cancer (PC-3) cell lines determined by surface staining with the flow cytometry analysis. (C) Neutralization of HLA-G significantly prevented tumor-induced CD4+ T cell senescence. Anti-CD3/CD28 pre-activated naïve CD4+ T cells were cocultured with different tumor cells at the ratio of 1:1 for 24 hours in the presence of 10 µg/mL anti-HLA-G neutralizing antibody or isotype antibody in the coculture system. CD4+ T cells were then separated and senescence-associated β-galactosidase (SA-β-Gal) activity was determined as described in figure 2. Results shown in the histogram are mean ± SD from three independent experiments. **p<0.01 and ***p<0.001. (D, E) Blockade of HLA-G either in CD4+ T cells (in D) or tumor cells (in E) decreased tumor-induced CD4+ T cell senescence. Anti-CD3 pre-activated CD4+ T cells or tumor cells were pretreated with 10 µg/mL anti-HLA-G neutralizing antibody for 2 hours, and then cocultured with respective untreated tumor or T cells, as described in figure 2. T cell senescence was determined by SA-β-Gal staining. Results shown in the histogram are mean ± SD from three independent experiments. *p<0.05, **p<0.01 and ***p<0.001. (F) Neutralization of HLA-G significantly prevented tumor-induced DNA damage response in CD4+ T cells. Anti-CD3 pre-activated CD4+ T cells were treated anti-HLA-G neutralizing antibody and then cocultured with different tumor cells as described in (D). Phosphorylation levels of ATM, H2AX, CHK2, and 53BP1 in cocultured T cells were analyzed with the flow cytometry analyses.
Figure 4
Figure 4
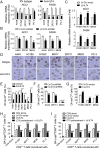
Tumor-derived immunoglobulin-like transcript 4 (ILT4) promotes T cell senescence via upregulation of tumor lipid metabolism. (A) Neutralization of ILT4 significantly reduced gene expression of key enzymes for fatty acid synthesis (ACC1 and FASN) in tumor cells. Human tumor cell lines were treated with anti-ILT4 neutralizing antibody (500 ng/mL) or isotype control antibody for 48 hours, and mRNA expression levels of ACC1 and FASN were determined by real-time quantitative PCR (qPCR). The expression of ACC1 and FASN genes was normalized to β-actin and adjusted to the levels in corresponding isotype antibody-treated cells (served as 1). Results shown are mean ± SD from at least three independent experiments. *p<0.05, **p<0.01 and ***p<0.001, compared with the cells treated with isotype antibody. (B) Knockdown of ILT4 in tumor cells downregulated expression levels of ACC1 and FASN by tumor cells. Tumor cell lines (A549, ZR751 and M628) were infected with lentivirus carrying ILT4 shRNA or control shRNA at the multiplicity of infection (MOI) of 5–10 for 48 hours and then mRNA expression of ACC1 and FASN were analyzed by real-time qPCR. The expression levels of ACC1 and FASN gene were normalized to β-actin and adjusted to the level in respective control group (served as 1). Results shown in the histogram are mean ± SD from at least three independent experiments. *p<0.05, compared with the control shRNA (LV-Ctr-shRNA)-transfected cells. (C) Overexpression of ILT4 in tumor cells upregulated expression levels of ACC1 and FASN by tumor cells. Tumor cell lines (H1650, MCF7, and M628) were infected with lentivirus carrying ILT4 or control vector at the MOI of 5–10 for 48 hours and then mRNA expression of ACC1 and FASN were analyzed by real-time qPCR as described in (B). *p<0.05 and **p<0.01, compared with the respective cells infected with lentivirus carrying control vector. (D, E) Neutralization of ILT4 significantly reduced lipid droplet (LD) formation in tumor cells. Different types of tumor cell lines were treated with anti-ILT4 neutralizing antibody (500 ng/mL) or isotype control antibody for 48 hours, and then stained for Oil red O. For cell lines with high LD accumulation (H1299, H1650, MCF7 and PC-3), positive cells were counted based on the cells with LDs of more than 1/3 cytoplasm. Results in (D) showed the typical images of tumor cells with the Oil red O staining. Results shown in (E) are mean ± SD from three independent experiments. *p<0.05, **p<0.01 and ***p<0.001. (F) Knockdown of ILT4 in tumor cells decreased LDs in tumor cells. Tumor cell lines were infected with lentivirus carrying ILT4 shRNA or control shRNA at the MOI of 5–10 for 72 hours and then stained for Oil red O. Results shown are mean ± SD from three independent experiments. *p<0.05, **p<0.01 and ***p<0.001, compared with the control shRNA (LV-Ctr-shRNA)-transfected cells. (G) Overexpression of ILT4 in tumor cells promoted LD accumulation in tumor cells. Tumor cell lines (H1650, MCF7, and M628) were infected with lentivirus carrying ILT4 at the MOI of 5–10 for 72 hours and then stained for Oil red O. Results shown are mean ± SD from three independent experiments. **p<0.01 and ***p<0.001, compared with the respective cells infected with lentivirus carrying control vector. (H, I) Inhibition of FASN activity in tumor cells reversed ILT4-induced CD4+ (in H) and CD8+ (in I) T cell senescence. Tumor cells were pretreated with FASN inhibitor C75 (5 µM) for 24 hours, and then infected with lentivirus carrying ILT4 for 48 hours in the presence of C75. The transfected cells were further cocultured with pre-activated T cells and T cell senescence were determined as described in figure 2. Results shown are mean ± SD from three independent experiments. ***p<0.001, compared with the LV-Ctr vector-transfected cells. ###p<0.001, compared with the corresponding LV-ILT4-transfected cells.
Figure 5
Figure 5
Immunoglobulin-like transcript 4 (ILT4) controls fatty acid synthesis and T cell senescence via ERK1/2 signaling pathway. (A) Knockdown of ILT4 expression decreased the phosphorylation of ERK1/2 but not P38 or JNK in tumor cells. Tumor cells were transfected with LV-ILT4-shRNA or LV-Ctr-shRNA for 72 hours, and the whole cell lysates were prepared for analysis of phosphorylated and total ERK1/2, P38, and JNK protein expression by the western blot. (B) Overexpression of ILT4 promoted activation and phosphorylation of ERK1/2 but not P38 or JNK in tumor cells. Tumor cells were transfected with lentivirus-based ILT4 or control vector for 72 hours, and the whole cell lysates were prepared for analysis of phosphorylated and total ERK1/2, P38, and JNK protein expression by the western blot. (C, D) Inhibition of ERK signaling restored ILT4-induced upregulation of ACC1 and FASN gene expression (in C) and accumulation of lipid droplets (LDs) (in D) in tumor cells. Different types of tumor cells were pretreated with ERK inhibitor U0126 (10 µM) for 24 hours, and then transfected with lentivirus-based LV-ILT4 or control LV-Ctr vector for 72 hours in the presence of 10 μM U0126. The gene expression levels of ACC1 and FASN were evaluated using the real-time qPCR (in C). LD accumulation was determined by the Oil red O staining (in D). Results shown in (C) and (D) are mean ± SD from three independent experiments. **p<0.01 and ***p<0.001, compared with cells transfected with the LV-Ctr vector. ###p<0.001, compared with the cells transfected with the LV-ILT4. (E, F) U0126 pretreatment in tumor cells prevented ILT4-induced CD4+ (in E) and CD8+ (in F) T cell senescence. Different types of tumor cells were pretreated with ERK inhibitor U0126 (10 µM) for 24 hours and then infected with lentivirus carrying ILT4 or control vector for 72 hours in the presence of U0126 (10 µM). Treated tumor cells were further cocultured with pre-activated T cells as described in figure 2, and SA-β-Gal activity in T cells was determined. Results shown in the histogram are mean ± SD from three independent experiments. *p<0.05, **p<0.01 and ***p<0.001, compared with the respective LV-Ctr vector group. ##p<0.01 and ###p<0.001, compared with the respective LV-ILT4 group.
Figure 6
Figure 6
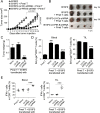
Tumor-derived PIR-B promotes tumor growth and induces T cell senescence in vivo. (A) Knockdown of PIR-B gene in E0771 breast cancer cells markedly inhibited transplanted cancer growth in immunocompetent C57BL/6 mice. However, overexpression of PIR-B in E0771 promoted tumor growth. Mouse breast cancer cell line E0771 (2 × 10⁵ cells/mouse) infected with lentivirus carrying PIR-B gene or shRNA against PIR-B were subcutaneously injected into female C57BL/6 mice. Tumor size was measured every 3 days and presented as mean ± SD (n=5 mice/group). (B) Representative tumor images obtained from the indicated groups at the endpoint of the experiments (day 24). (C) E0771 breast cancer cells with PIR-B knockdown had decreased tumor weights, but cancer cells overexpressing PIR-B had increased tumor weights. Results shown are mean ± SD of tumor weights from indicated groups at the endpoint of the experiments (day 24) (n=4 mice/group). **p<0.01 and ***p<0.001, compared with the LV-Ctr vector group. (D) Knockdown of PIR-B gene in E0771 breast cancer significantly prevented T cell senescence in blood and tumor-infiltrating lymphocytes (TILs). In contrast, overexpression of PIR-B in tumor cells remarkably induced T cell senescence. Lymphocytes were separated from blood and tumor tissues, and SA-β-Gal expression determined. Results are presented as mean ± SD (n=4 mice/group). *p<0.05 and ***p<0.001, compared with the LV-Ctr vector group. (E) Knockdown or overexpression of PIR-B in E0771 did not alter lymphocyte infiltration in tumor tissues. Tumor tissues from different groups were isolated and the absolute numbers of TILs in each mouse were counted and divided by the tumor volume. Data shown are mean ± SD from different groups (n=4 mice/group). (F) Knockdown of PIR-B gene in E0771 tumor cells increased CD8+ T cell populations but not CD4+ T cells in TILs. However, overexpression of PIR-B gene in tumor cells did not alter CD4+ and CD8+ T cell subsets in TILs. TILs were separated from tumor tissues of each group and fractions of T cell subsets were evaluated by the flow cytometry analysis. Results shown are mean ± SD from different groups (n=4 mice/group). **p<0.01, compared with the LV-Ctr vector group. (G, H) Knockdown of PIR-B gene in E0771 breast cancer significantly increased IFN-γ+ cell populations in both tumor-infiltrating CD4+ and CD8+ T cells (in G), and granzyme B+ and perforin+ cell populations in tumor-infiltrating CD8+ T cells (in H). In contrast, overexpression of PIR-B in tumor cells dramatically decreased those populations in tumor-infiltrating CD4+ and CD8+ T cells. TILs were separated from tumor tissues, and different T cell subsets/populations were analyzed by the flow cytometry. Data shown are mean ± SD from different groups (n=4 mice/group). *p<0.05 and **p<0.01, compared with the LV-Ctr vector group. (I–K) Knockdown of PIR-B gene in E0771 cells inhibited tumor growth and decreased tumor sizes and weights in immunodeficient NSG mice. However, overexpression of PIR-B gene in tumor cells promoted tumor growth and increased tumor sizes and weights in NSG mice. Cell preparation, cell injection numbers and procedures were identical to descriptions in (A). Tumor sizes were measured every 3 days (in I). Mice were sacrificed and tumors in different groups were separated and weighed (in J and K) at day 22 after tumor injection. Data shown in (I) and (K) are mean ± SD from different groups (n=4 mice/group). **p<0.01 and ***p<0.001, compared with the LV-Ctr vector group (in K). (L) PIR-B knockdown in tumor cells downregulated the gene expression levels of key enzymes involved in lipid metabolism, while PIR-B overexpression enhanced their expression levels in tumor cells from NSG mice. Total RNAs were extracted from fresh tumor tissues of each tumor-bearing NSG mouse and gene expression levels of each enzyme were determined by the real-time quantitative PCR analysis. All the data are expressed as mean ± SD from different groups (n=4 mice/group). *p<0.05, **p<0.01 and ***p<0.001, compared with the LV-Ctr vector group.
Figure 7
Figure 7
PIR-B blockade enhances antitumor efficacy mediated by the adoptively transferred tumor-specific CD8+ T cells in vivo. (A–C) PIR-B knockdown showed enhanced antitumor immunity mediated by the adoptively transferred CD8+ T cells. Mouse melanoma cell line B16F0 cells (2 × 10⁵ cells/mouse) infected with/without lentivirus carrying shRNA against PIR-B or control shRNA were subcutaneously injected into 6–8 week C57BL/6 mice. When the tumor diameter reached 5–6 mm, all the mice were intravenously injected with anti-CD3/anti-CD28 pre-activated Pmel CD8+ T cells (2 × 10⁶ cells/mouse) after irradiation with a dose of 500 cGy. Tumors sizes were measured every 3 days (in A). When mice were euthanized, tumors in each group were isolated and weighed (in B and C). All the data are presented as mean ± SD (n=5 mice/group). **p<0.01, compared with the LV-Ctr-shRNA group (in C). (D) Knockdown of PIR-B in tumor cells significantly prevented senescence induction in the adoptively transferred CD8+ T cells in blood and TILs from tumor-bearing mice. The transferred Pmel CD8+ T cells were isolated from blood and tumor tissues, and stained for SA-β-Gal. Data shown are mean ± SD from different groups (n=4 mice/group). ***p<0.001, compared with the LV-Ctr-shRNA group. ###p<0.001, compared with the Pmel T only group. (E) Knockdown of PIR-B in tumor cells enhanced IFN-γ-producing cell populations in adoptively transferred CD8+ T cells in the blood and TILs. IFN-γ+CD8+ T cell populations in blood and TILs were determined by the flow cytometry analysis. Results shown are mean ± SD from different groups (n=4 mice/group). ***p<0.001, compared with the LV-Ctr-shRNA group.

Similar articles

Cited by

References

    1. Thommen DS, Schumacher TN. T cell dysfunction in cancer. Cancer Cell 2018;33:547–62. 10.1016/j.ccell.2018.03.012 - DOI - PMC - PubMed
    1. Zou W, Wolchok JD, Chen L. Pd-L1 (B7-H1) and PD-1 pathway blockade for cancer therapy: mechanisms, response biomarkers, and combinations. Sci Transl Med 2016;8:328rv4. 10.1126/scitranslmed.aad7118 - DOI - PMC - PubMed
    1. Topalian SL, Drake CG, Pardoll DM. Immune checkpoint blockade: a common denominator approach to cancer therapy. Cancer Cell 2015;27:450–61. 10.1016/j.ccell.2015.03.001 - DOI - PMC - PubMed
    1. Sharma P, Allison JP. Immune checkpoint _targeting in cancer therapy: toward combination strategies with curative potential. Cell 2015;161:205–14. 10.1016/j.cell.2015.03.030 - DOI - PMC - PubMed
    1. Rosenberg SA, Restifo NP. Adoptive cell transfer as personalized immunotherapy for human cancer. Science 2015;348:62–8. 10.1126/science.aaa4967 - DOI - PMC - PubMed

Publication types

MeSH terms

LinkOut - more resources

  NODES
INTERN 4
twitter 2