. 2022 Dec 1;13(1):7404.
doi: 10.1038/s41467-022-35014-w.

Dietary glucosamine overcomes the defects in αβ-T cell ontogeny caused by the loss of de novo hexosamine biosynthesis

Affiliations

Dietary glucosamine overcomes the defects in αβ-T cell ontogeny caused by the loss of de novo hexosamine biosynthesis

Guy Werlen et al. Nat Commun. .

Abstract

T cell development requires the coordinated rearrangement of T cell receptor (TCR) gene segments and the expression of either αβ or γδ TCR. However, whether and how de novo synthesis of nutrients contributes to thymocyte commitment to either lineage remains unclear. Here, we find that T cell-specific deficiency in glutamine:fructose-6-phosphate aminotransferase 1 (GFAT1), the rate-limiting enzyme of the de novo hexosamine biosynthesis pathway (dn-HBP), attenuates hexosamine levels, blunts N-glycosylation of TCRβ chains, reduces surface expression of key developmental receptors, thus impairing αβ-T cell ontogeny. GFAT1 deficiency triggers defects in N-glycans, increases the unfolded protein response, and elevates γδ-T cell numbers despite reducing γδ-TCR diversity. Enhancing TCR expression or PI3K/Akt signaling does not reverse developmental defects. Instead, dietary supplementation with the salvage metabolite, glucosamine, and an α-ketoglutarate analogue partially restores αβ-T cell development in GFAT1T-/- mice, while fully rescuing it in ex vivo fetal thymic organ cultures. Thus, dn-HBP fulfils, while salvage nutrients partially satisfy, the elevated demand for hexosamines during early T cell development.


Conflict of interest statement

The authors declare no competing interests.

Figures
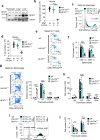
Fig. 1
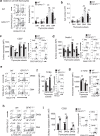
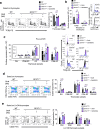
Fig. 1. Defective αβ-T cell development in the absence of GFAT1.
a Total cell extracts from thymocytes, lung, and liver from male and female WT (+/+) or mice with specific deletion of GFAT1 in T cells (GFAT1T−/−) were subjected to SDS-PAGE and immunoblotted using the indicated antibodies. Representative blot out of two independent experiments with similar results is shown. b Thymocytes from male and female 5-week-old Lck-Cre−/−/Gfat1f/f (WT), Gfat1+/+/Lck-Cre+/− (Lck-Cre+/−) or Lck-Cre+/−/Gfat1f/f (GFAT1T−/−) littermates or age-matched were harvested and counted by trypan blue exclusion. Each symbol represents one mouse (n = 4–8 mice each). cf Splenocytes of 5-week-old male and female Lck-Cre−/−/Gfat1f/f (WT), Gfat1+/+/Lck-Cre+/− (Lck-Cre+/−) or Lck-Cre+/−/Gfat1f/f (GFAT1T−/−) littermates or age-matched were stained for TCRβ, CD4 and CD8α followed by flow cytometric analysis. Shown are the proportions of T cells among splenocytes (c); total number of T cells in each mouse (d) (n = 4–6 mice each); proportions of CD4 T helper (CD4+ TH) and CD8 T cytotoxic (CD8+ TC) cells among peripheral T cells (e); total cell number of CD4+ TH and CD8+ TC subsets in the spleen of the respective mice (f) (n = 4–6 mice). Representative FACS plots (c, e) from three experiments with similar results are shown. gj Thymocytes from male and female Lck-Cre−/−/Gfat1f/f (WT), Lck-Cre+/− (Lck-Cre+/−) or Lck-Cre+/−/Gfat1f/f (GFAT1T−/−) littermates or age-matched were stained for CD4, CD8α, CD147 & TCRβ followed by flow cytometric analysis to measure the proportion of thymocyte subsets as indicated in each quadrant. Bar graph represents proportion (g) or absolute cell number (h) (n = 4–8 mice). CD8+CD4 thymocytes were gated for TCRβlow/CD147+ to distinguish CD8-ISP (TCRβlow) from lineage-committed CD8-SP (TCRβhigh) cells (i). Bar graph (j) represents absolute cell numbers of CD8-ISP and CD8-SP (n = 4–8 mice). Representative FACS plots (g, i) from three experiments with similar results are shown. All data from (bd, fj) are mean ± SD. *p < 0.05, **p < 0.01, ***p < 0.001, ****p < 0.0001 using one-way ANOVA followed by Tukey’s post-hoc test. Source data are available for (aj).
Fig. 2
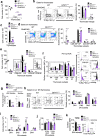
Fig. 2. Defective expression of key surface receptors at the DN stage in GFAT1-deficient thymocytes.
Thymocytes from male and female WT (Lck-Cre−/−/Gfat1f/f) and knockout (Lck-Cre+/−/Gfat1f/f; referred to as GFAT1T−/−) littermates were stained for Lin, CD4, CD8α, CD25, CD44, CD27, Notch1, and TCRβ followed by flow cytometric analysis to measure the proportion of Lin DN subsets as indicated in each quadrant (a-f, i) or further stained for intracellular (ic) TCRβ (g-h) before flow cytometry. a, b FACS plots and bar graphs represent proportion (a) or absolute cell number (b), (n = 9 mice). c, d DN3 thymocytes were further analyzed for the proportion of CD27DN3a and CD27+DN3b subsets (see also Supplementary Fig. 2a) followed by analysis of CD27 and Notch1 surface expression. Bar graphs of median fluorescence intensity (MFI) of CD27 (c) and Notch1 (d) expressed on the surface of DN2, DN3a, DN3b, and DN4 thymocytes (n = 3 mice with 3 technical repeats) and respective representative FACS plots are shown. eg Representative FACS plots showing DN3b and DN4 subsets that express Notch1 and TCRβ is shown (e). Percentage is indicated in each quadrant. Representative FACS plots and bar graphs represent median fluorescence intensity (MFI) of TCRβ expression on the surface of DN3b and DN4 cells (f)(n = 9 mice) or ic-TCRβ expression (g)(n = 6 mice). h DN3b and DN4 subsets were analyzed for ic- and surface (s) TCRβ staining. Representative FACS plots with the percentage of cells in each quadrant are shown. i CD25 expression on the surface of DN2, DN3a and DN3b thymocyte subsets. Bar graph of median fluorescence intensity (MFI) and respective representative FACS plots of CD25 staining are shown (n = 9 mice). FACS plots from (ai) are representative of at least 3 experiments with similar results. All data (ad, f, g, i) are mean ± .SD. *p < 0.05, **p < 0.01, ***p < 0.001 using a two-sided Student’s t test. Source data are available for (ai).
Fig. 3
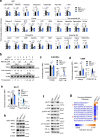
Fig. 3. Defects in hexosamine, glycosylation, and increased unfolded protein response in GFAT1-deficient thymocytes.
Thymocytes from male and female age-matched WT, GFAT1T−/− and /or rictorT−/− mice were used for the following except for b. a Metabolites were extracted and analyzed from equivalent thymocyte numbers. Graphs represent mean fold changes relative to WT (n = 5 independent samples; [1 WT, pool of 3-5 GFAT1T−/− and 2–4 rictorT−/− per sample). Error bars denote SD. *p < 0.05, **p < 0.01, ***p < 0.001, ****p < 0.0001 using one-way ANOVA followed by Tukey’s post-hoc test. See also Supplementary Fig. 3b. b Thymocytes were harvested from male and female OT-1/WT and OT-1/GFAT1T−/− mice and treated with vehicle or MG132 for 4 h. Lysates were subjected to lectin pull-down assays followed by immunoblotting of TCRβ. Fold changes relative to TCRβ expression in untreated OT-1/WT cells (lane 1 for input, lane 5 for pull down) are indicated below each blot. Representative blots from two independent experiments with similar results are shown. ce Thymocytes were harvested, intracellularly stained (c) or surface stained (d, e), then analyzed by flow cytometry. Bar graphs represent mean fluorescence intensity (MFI). n = 5–8 mice for (ce) and the respective representative FACS plots from three experiments with similar results are shown. All data are mean ± SD. *p < 0.05, **p < 0.01, ***p < 0.001, ****p < 0.0001 using one-way ANOVA followed by Tukey’s post-hoc test. f, h Protein extracts of thymocytes were resolved and subjected to immunoblotting. β-actin was used as loading control for all blots. Shown are representative immunoblots from at least three independent experiments with similar results. Closest MW (KD) marker is indicated for each blot. g Protein extracts from thymocytes were subjected to quantitative proteomics and data were analyzed by Ingenuity Pathway Analysis (IPA). Shown is the heat map of statistically significant (p < 0.05 as determined using two-sided Student’s t test) canonical metabolic pathway alterations in GFAT1- and rictor-deficient thymocytes relative to WT. Red asterisks denote an increase of both tRNA charging and salvage pathways of pyrimidine. Pathways are ranked according to the z-score that predicts upregulation (orange) or downregulation (blue). See complete heat map in Supplementary Fig. 3d. Source data are available for a-f,h.
Fig. 4
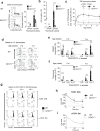
Fig. 4. GFAT1 deficiency decreases the viability and proliferation of αβ-thymocytes but increases γδ-thymocyte cell numbers.
Thymocytes from male and female age-matched WT and GFAT1T−/− mice were used for the following experiments. a-b Thymocytes were stained for CD4, CD8, CD44, CD25, TCRβ, γδTCR and analyzed by flow cytometry. Representative plots with bar graph of the proportion of subsets (a) or absolute cell numbers (b) expressing surface TCRβ (αβ-lineage) or γδTCR (γδ-lineage) are shown (a, b, n = 8–12 mice). c 0-, 1-, 3-, 5- and 9-week mice were stained for Lin, CD4, CD8α, CD25, CD44, TCRβ and γδTCR followed by flow cytometric analysis of αβ- (express TCRβ) or γδ-lineage subsets among DN thymocytes. The percentage of each lineage is plotted relative to the mouse age (n = 1–6 mice). df Thymocytes from e18/19 and 7-week-old mice were harvested and stained with γδTCR, CD24, CD73, Vγ1.1, Vγ2 and Vγ3 followed by flow cytometric analysis. Partition analysis of immature (CD24CD73 & CD24+CD73), maturing (CD24+CD73+) and mature (CD24CD73+) γδ-thymocyte subsets (d). Shown is a representative plot of three experiments with similar results. Percentage is indicated in each quadrant. Bar graphs represent proportion (e) and total number (f) of mature CD24CD73+γδTCR+ γδ-thymocytes expressing either Vγ1.1, Vγ2 or Vγ3 (e, f, n = 3–9 mice). g Thymocytes from 5-week-old mice were labeled with CFSE and cultured ex vivo for the indicated hours then harvested and stained as in (c), followed by flow cytometry. Gating was set on live thymocytes and either TCRβ+-DN4 (upper panel) or γδTCR+ DN cells (lower panel). Shown is one representative experiment out of three with similar results. h Thymocytes were cultured ex vivo for 24 h or 48 h and stained for Lin, CD4, CD8α, CD25, CD44, Annexin V, and TCRβ. Graph shows viability of TCRβ+-DN4 cells (gated on TCRβ+ DN4 cells) (h) or γδTCR+ DN cells (gated on DN thymocytes expressing γδTCR) (I); h, i, n = 4 mice each. See also Supplementary Fig. 4. For all graphs in (ac, e, f, h, i), data are mean ± SD, **p < 0.01, ***p < 0.001 using two-sided Student’s t test. Source data are available for (af, h, i).
Fig. 5
Fig. 5. Upregulation of PI3K/Akt signals in the absence of GFAT1 promotes growth and survival of αβ-T cells while increased ERK signals skew lineage commitment towards γδ-T cells.
Thymocytes from male and female WT, GFAT1- or combined PTEN/GFAT1T−/− mice were used for the following. ae Thymocytes were stained for Lin, CD4, CD8α, CD25, CD44, CD5,TCRβ, and γδTCR, and intracellularly stained for pS473-Akt (a, b) or pT202/Y204-ERK (c). After flow cytometric analysis, proportion of cells that positively stained for each phosphorylated protein was plotted (ac). Representative results out of three independent experiments with similar results are shown (ac). Bar graphs (a, c) represent the amounts (median fluorescence intensity; MFI) of each specific phosphorylation (n = 3–9 mice each). Size (FSC) and granularity (SSC) of DN4 cells expressing TCRβ on their surface and with (pS473+-Akt TCRβ+-DN4) or without phosphorylated Akt at S473 (TCRβ+-DN4 no pS473-Akt) was plotted (b). Numbers in each plot represent proportion of “blasting” cells. Bar graphs (d, e) represent the expression (median fluorescence intensity; MFI) of CD5 (n = 3 mice) (d) as well as either γδTCR or TCRβ (pre-TCR) (n = 6 mice)(e) on the surface of CD4CD8Lin DN thymocytes. Representative FACS plots of the respective receptor staining out of three independent experiments with similar results are shown on the right side of the corresponding bar graph. f, g Thymocytes were surface-stained for γδTCR followed by phospho-ERK intracellular staining. A representative FACS plot of γδTCR staining (f) or phosphorylated-ERK (g) out of three experiments with similar results is shown. Bar graphs represent the median fluorescence intensity (MFI) of γδTCR surface expression (f) or phosphorylated ERK (g) (n = 4 mice each with 3 technical replicates). All bar graphs (ag) denote mean ± SD. *p < 0.05, **p < 0.01, ***p < 0.001, ****p < 0.0001 using two-sided Student’s t test (c, d) or one-way ANOVA followed by Tukey’s post-hoc test (a, eg). See also Supplementary Fig 5. Source data are available for (ag).
Fig. 6
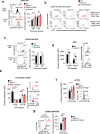
Fig. 6. Glucosamine supplementation rescues αβ-T cell development in fetal thymic organ cultures.
WT or GFAT1T−/− mice were used for the following experiments. Thymic lobe from fetus was incubated in complete media containing glucosamine (GlcN) with or without dimethyl-2-ketoglutarate (DKG) and the adjoining lobe was cultured in complete media only as control. Thymocytes were stained for CD4, CD8, CD25, CD44, TCRβ, and γδTCR and analyzed by flow cytometry. a Plot and bar graph represent proportion of subsets expressing either surface TCRβ (αβ-lineage) or γδTCR (γδ-lineage) after 7 days of culture (n = 3–5 fetal lobes). Plot is representative of three experiments with similar results (a). b Bar graph showing TCRβ and γδTCR levels (median fluorescence intensity; MFI) on the surface of αβ- and γδ-lineage-committed thymocytes, respectively (n = 3–5 fetal lobes) and representative FACS plots of the respective receptor staining from three experiments with similar results are shown. c Bar graphs (median fluorescence intensity; MFI) (n = 3–5 fetal lobes) and FACS plots of TCRβ levels expressed on the surface of each subset (c) The inset is a blowup of TCRβ expression on DN to DP stages. FACS plots are representative of three experiments with similar results. d Thymocyte subsets expressing either CD4 or CD8 were plotted. FACS plots are representative of three experiments with similar results. Bar graphs show proportion of different thymocyte subsets (n = 3–5 fetal lobes). e Immature CD4CD8Lin DN thymocytes were stained for CD25 and CD44 expression. Representative FACS plots out of three experiments with similar results showing relative number of DN subsets are indicated in each quadrant and plotted in the bar graph (n = 3 fetal lobes). All graphs from (ae) are mean ± SD. *p < 0.05, **p < 0.01, ***p < 0.001, ****p < 0.0001 using one-way ANOVA followed by Tukey’s (a, b) or Šidák’s (ce) post-hoc test. See also Supplementary Fig. 6. Source data are available for (ae).
Fig. 7
Fig. 7. Dietary supplementation of GFAT1T−/− mice with glucosamine and α-ketoglutarate partially restores αβ-thymocyte development by increasing the viability of DN and SP cells.
Three-week-old male and female GFAT1T+/+ (WT) or GFAT1T−/− littermates were fed with regular water or water containing GlcN and DKG (100 mM each) (GlcN/DKG-supplemented GFAT1T−/− mice are also referred to as GD+) and thymocytes were harvested after 1 month. Cells were stained for Lin, CD4, CD8, CD25, CD44, Annexin V, TCRβ and γδTCR and analyzed by flow cytometry (af, hk) or subjected to metabolite analysis (g). a Total cell number for each mice are indicated (n = 3 mice each). b, c Proportion of subsets expressing either high TCRβ or high γδTCR on their surface are shown in representative plots from three experiments with similar results and bar graph (b). Absolute numbers of αβ-lineage cells are shown (c). (b, c, n = 3 mice with 3 technical replicates each). See also Supplementary Fig. 7a. d, e Thymocyte subsets expressing either CD4 or CD8 were plotted. FACS plots are representative of three independent experiments with similar results. Bar graphs represent the proportion (d) and absolute number (e) of each subset (d, e, n = 3 mice each with 3 technical replicates each). Insets are blowups of the absolute number of CD8-ISP and CD8-SP cells. f Bar graph (median fluorescence intensity; MFI) of TCRβ expressed on the surface of each thymocyte subset with corresponding FACS plots. Inset is a blowup of TCRβ expression on DN to DP stages (n = 3 mice each with 3 technical replicates each). Representative FACS plots are from three experiments with similar results. g Metabolites were isolated from thymocytes and analyzed by LC/MS. Bar graphs represent fold changes of indicated metabolite relative to WT (n = 4 independent samples each). See also Supplementary Fig. 7c. h, k Immature CD4CD8Lin DN thymocytes were stained for CD25 and CD44 expression. Relative subset numbers are indicated in each quadrant and plotted in the bar graph (h). Representative FACS plots are shown from three experiments with similar results. Total cell numbers from each DN subset were plotted (i). The viability of TCRβDN3 and TCRβ+-DN4 was plotted (j). Bar graph of TCRβ expression (median fluorescence intensity; MFI) on the surface of DN4 thymocyte and representative FACS plot from three experiments with similar results are shown (k). n = 3 mice each with 3 technical replicates each (hk). All graphs from (ak) denote mean ± SD. **p < 0.01, ***p < 0.001, ****p < 0.0001 using one-way ANOVA followed by Šidák’s (af, g, j, k) or Tukey’s (h, i) post-hoc test. Source data are available for (ak).

Similar articles

Cited by

References

    1. Fahl, S. P., Kappes, D. J. & Wiest, D. L. In Signaling Mechanisms Regulating T Cell Diversity and Function (eds J. Soboloff & D. J. Kappes) 85–104 (CRC Press/Taylor & Francis, 2018). - PubMed
    1. Ciofani M, Zuniga-Pflucker JC. Determining gammadelta versus alphabeta T cell development. Nat. Rev. Immunol. 2010;10:657–663. doi: 10.1038/nri2820. - DOI - PubMed
    1. Werlen G, Hausmann B, Naeher D, Palmer E. Signaling life and death in the thymus: timing is everything. Science. 2003;299:1859–1863. doi: 10.1126/science.1067833. - DOI - PubMed
    1. Werlen, G., Jain, R. & Jacinto, E. MTOR signaling and metabolism in early T cell development. Genes (Basel)12, 728 (2021). - PMC - PubMed
    1. Kreslavsky T, Garbe AI, Krueger A, von Boehmer H. T cell receptor-instructed alphabeta versus gammadelta lineage commitment revealed by single-cell analysis. J. Exp. Med. 2008;205:1173–1186. doi: 10.1084/jem.20072425. - DOI - PMC - PubMed

Publication types

LinkOut - more resources

  NODES
Note 4
twitter 2